Analyzing Data: Common Sense in Statistics and Avoiding Misleading Information
This guide discusses important concepts in critical thinking and data analysis, highlighting the distinctions between parameters and statistics. It provides techniques for improving data interpretation skills, emphasizing common sense, context, and careful evaluation of sources. Readers will learn to recognize and avoid misleading visual representations like graphs and pie charts, including understanding percentages and their calculations. By applying these principles, individuals can better navigate data-driven claims and advertisements while enhancing their statistical literacy.


Analyzing Data: Common Sense in Statistics and Avoiding Misleading Information
E N D
Presentation Transcript
Notes #3 Ch 1-3: Critical Thinking Using Common Sense to Analyze Data
2 Ways to Look at Data • A parameter • Numerical measurement describing some trait of an entire population Ex. Total population of the City of Alhambra is 83,089, where 47.3% of the population are men. U.S. Census 2010 Data
2. A statistic • Numerical measurement describing some trait of a sample group. Ex. Based on a sample of 41 students in Ms. Ng’s Stats class, it was found that 12% of them selected Math as their favorite subject.
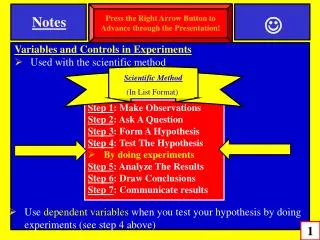
How do you improve skills in interpreting data? • Use common sense • Think carefully about the context, source, method, conclusions and practical implications.
How Stats is Misused? 1. Evil intent on the part of dishonest people. “It’s all lies!” 2. Mistakes on the part of people who don’t know any better.
Examples of Misleading Graphs and Data (A) (B) Q: What’s wrong with this graph? ANS: Personal income from Graph (A) and (B) is the same. CA: $32, 996 Nev: $30,180 BUT the bars are misleadingin Graph (B). Graph (B) bars show CA income is “a lot” higher than Nev’s income (misleading)
How to avoid being misled by graphs? • Analyze the numerical information given in the graph • Do not rely only on the graph’s shape. • READ labels and units on the axes
Percentages • Misleading or unclear percentages are sometimes used. Ex. 100% of the teachers surveyed have a dog as a pet, therefore dogs are the preferred pet for teachers. Truth (behind the survey): Only 5 teachers were surveyed, so 5 of 5 teachers, give you 100%. Problem? Survey not fairly representing the faculty, making the data misleading.
How to find the truth behind data with Percentages? • Find out the actual number of individuals surveyed from the sample or population. • Conclusions should not be based on samples that are far too small (i.e. 5 teachers surveyed) • Top 10 False Advertisements that got caught
Representing Percentages w/ Pie Charts What are pie charts? ANS: a special chart that uses "pie slices" to show relative sizes of data(usually in percentage). Ex.
4 Steps to Create a Pie Chart • Put your data into a data table, with a categorical group & Number count/frequency. Then add up the total. Ex.
2. Determine the percentage for each group type, and insert a column to the data table.
3. Determine how many degrees are for each "pie slice” Equation (Calculate Degrees of the Sector “pie slice” [Number count ÷Total]× 360°= Degree of Sector
4. Draw a circle, then use a protractor to mark the degrees of each sector. Ex. Comedy makes of 20% of the pie chart, with a sector at 72o How to make a pie chart?
Notes #4 Ch 1-3: Working with Percentages
What % really means? ANS: It means “divided by 100” Ex. When asked to find the percent of something you: 1. Drop the % symbol 2. Divide the percentage value by 100. 3. Multiply to target population or sample #
Sample Problem 1: 3% of MKHS’s 2408 ASB population are mixed races. What is the total number count of these students? [3 ÷ 100] x 2408 = [0.03] x 2408 = 72.24 ANS: In MKHS’s ASB population of 2408 students, there are approximately 72 students who are mixed races.
Converting Fraction to % When you convert from a fraction to a % you: 1. Divide denominator into the numerator to get a decimal # 2. Multiply decimal # by 100% Sample Problem #2 What is the in percent? a. 3 ÷ 20 = 0 .15 0 .15 x 100% = 15%
Decimal to % When converting a decimal to a percentage you: • Multiply decimal to 100% Sample Problem #3 • Convert 0.786 to a percent 0.786 x 100% = 78.6%
Percentage to Decimal • To convert percentage to decimal you: • Delete % symbol • Divide by 100 Sample Problem #4 What is 37% in decimal?