Download
1 / 41
420 likes | 563 Vues
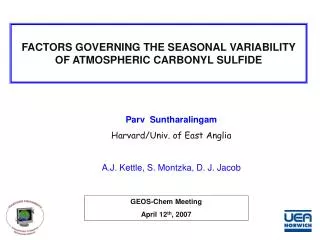
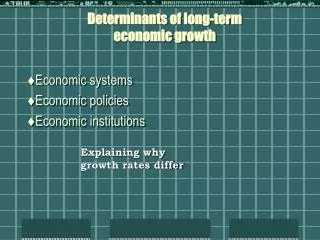
Long-term growth in global gross primary production based on atmospheric carbonyl sulfide. Elliott Campbell, Assistant Professor Sierra Nevada Research Institute & College of Engineering UC Merced LLNL, August 11, 2011. Roadmap. Motivation Background Global atmospheric COS model

E N D
Long-term growth in global gross primary production based on atmospheric carbonyl sulfide Elliott Campbell, Assistant Professor Sierra Nevada Research Institute & College of Engineering UC Merced LLNL, August 11, 2011
Roadmap • Motivation • Background • Global atmospheric COS model • Model vs. observations • Other activities
CO2 Fertilization Critical Uncertainty in Climate Forecasts • Current measurement techniques • Limited to small spatial and temporal scales • Wide range of results… no consensus
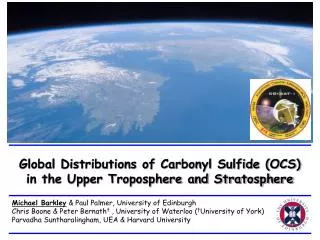
Carbonyl Sulfide (COS, OCS, CSO) • Source for stratospheric sulfate aerosol. • Important role in stratospheric ozone. • A novel tracer of terrestrial photosynthesis?
Global Budget (Montzka et al., JGR, 2008)
Leaf Scale • Leaf-scale relative uptake: 1.0 – 3.8 • Simple COS Plant Uptake (Sandoval-Soto, et al., Biogeosciences, 2008)
Plot Scale • Relaxed eddy accumulation (Xu et al., 2002) • Canopy gradient approach (Blonquist et al., 2011)
Experiment • Airborne Measurements • Regional Atmospheric Modeling
Regional Scale (Campbell et al., Science, 2008)
Geoengineering via Surface COS Emissions (Mills, EGU, 2008)
Global Scale • Post-industrial [COS] rise is unprecedented in 2000 year record • Trends are similar to SO2 emissions suggesting that anthropogenic source may be a driver • Relationship to GPP? (Montzka et al., 2004; Aydin et al., 2008, Smith et al., 2010)
Global Box Model • Simple model useful for: • Long life-times • Uncertainty and sensitivity analysis • Transparent approach
Sources • Oceans • Magnitude assuming steady state at 1850 • Trend assuming decline since 1980 • Anthropogenic • Magnitude by minimizing COS error • Trend based on SO2 inventories
[COS]: Simulated (Previous time step) • [CO2]: Observations • GPP: C4MIP or scaled relative to [CO2] • VCOSCO2: Range of top-down and bottom-up VCOSCO2 C4MIP
Summary • The atmospheric COS simulations, driven by a wide range of source and sink estimates, only successfully captured the observed COS trends for simulations that included the quantitative relationship between COS plant uptake and GPP • The COS observations were most consistent with the COS simulations that were driven by high GPP-CO2 sensitivity, rather than low GPP-CO2 sensitivity • Since the assumption of low GPP-CO2 sensitivity in carbon-climate models results in anomalous temperature forecasts, the COS constraint may help improve climate forecasts
Sustainable Domain for Bioenergy (Campbell, Lobell, & Field, ES&T, 2008)
Transportation per Cropland Area a) Ethanol b) Bioelectricity (Campbell, Lobell, & Field, Science, 2009)
Energy Security is not independent of climate change Volatility = 15% Volatility = 30% (Campbell, Sloan, Snyder, et al., In Prep)
Optical Properties of Emmissions (Campbell et al., In Prep)
Acknowledgements Support • NSF/CAREER: CBET • DOE/NICCR • DOE/BER Students:XianyuYang, Mohamad Abu-Naser Collaborators • DOE/LBL: Margaret Torn • Stanford/Carnegie: Joe Berry, Chris Field, David Lobell • NOAA: Steve Montzka
Thank you! Elliott Campbell, Assistant Professor Sierra Nevada Research Institute & College of Engineering ecampbell3@ucmerced.edu, 209.631.9312, skype: elliott.campbell
Junge Plot of Lifetime (Campbell et al., Science, 2008)
COS Lifetime • Previous studies: 1.5 – 8.9 y from variety of methods • Recent budget estimates: 1.5 – 3 y (Montzka et al., JGR, 2007) • Junge budget estimates : 0.8 – 2.3 y (Campbell et al., Science, 2008)