Download
1 / 29
390 likes | 620 Vues
Integrated Assessment Models of Economics of Climate Change. Economics 331b. Integrated Assessment (IA) Models of Climate Change. What are IA model? These are models that include the full range of cause and effect in climate change (“end to end” modeling).

E N D
Integrated Assessment Modelsof Economics of Climate Change Economics 331b
Integrated Assessment (IA) Models of Climate Change • What are IA model? • These are models that include the full range of cause and effect in climate change (“end to end” modeling). • They are necessarily interdisciplinary and involve natural and social sciences • Major goals: • Project the impact of current trends and of policies on important variables • Assess the costs and benefits of alternative policies • Assess uncertainties and priorities for scientific and technology research
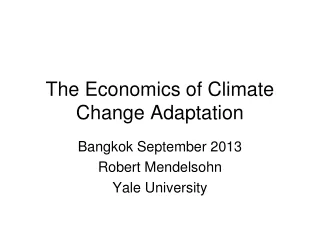
Pareto Improvement from Climate Policy Person or nation 1 Bargaining region (Pareto improving) Inefficient initial (no-policy) position Person or nation 2
Elements of building/using an IAM • Economics • Population • Inputs: energy, capital, land, … • Technology (total factor productivity) 2. Emissions of CO2 and other GHGs 3. Carbon cycle, forcings, temperature, other geophysical 4. Impacts or damages 5. Policies • Emissions controls, taxes, regulations, subsidies • International strategies for global externalities
Basic economic methodology of IA models We will use a very simple IA model to illustrate – the Yale “DICE” model. Last published version is 2007 in your assignment Also: - Regional version (RICE-2010) - Experimental or beta DICE-2010 in Excel format Lint will give overview of IAM in section this week.
Basic structure of IAM Economic sectors (more or less elaborate): Q = A F(K, L) = C + I plus: • Energy sector • Emissions • Abatement • Climate damages Geophysical sectors: • Carbon cycle • Climate model • Impacts
I. Economics: DICE/RICE model example Population exogenous: use UN and IIASA projections. - Should we have endogenous fertility? Total factor productivity exogenous • Problem that technological change is endogenous, particularly with large changes in energy prices Savings rate optimized by country • Use Solow-Ramsey model of optimal economic growth Put all these together (for 12 regions j=US, EU, …)
Modeling Strategies (II): Emissions Emissions trajectories: Start with data on Q, L, and E of CO2 for major countries Estimate population, productivity, emissions growth Project these by decade for future Then aggregate up by twelve major regions (US, EU, …) Constrain by global fossil fuel resources This is probably the largest uncertainty over the long run.
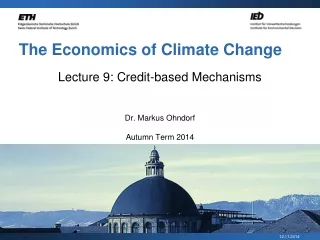
Modeling Strategies (III): Climate Models Climate model Idea here to use “reduced form” or simplified models. As we have seen, large models have very fine resolution and require supercomputers for solution and cannot be used in economic modeling. We take two-layers (atmosphere, deep oceans) and decadal time steps. Calibrated to ensemble of models in IPCC science reports.
.6 .4 .2 .0 -.2 -.4 -.6 1840 1880 1920 1960 2000 Y E A R T_DICE2007 T _Hadley T _GISS Actual and predicted global temperature history
Modeling Strategies (IV): Impacts • Central difficulty is evaluation of the impact of climate change on society • Two major areas: • market economy (agriculture, manufacturing, housing, …) • non-market sectors • human (health, recreation, …) • non-human (ecosystems, fish, trees, …)
Summary from Tol Survey Richard Tol, “The Economic Impact of Climate Change,” Journal of Economic Perspectives, Vol. 23, No. 2, Spring 2009
Modeling Strategies (V): Abatement costs These are the abatement cost functions we discussed in energy economics. • Some use econometric analysis of costs of reductions • Some use engineering/mathematical programming estimates • DICE model generally uses “reduced form” estimates of marginal costs of reduction as function of emissions reduction rate • We will return to this later.
Economic Theory Behind Modeling 1. Basic theorem of “markets as maximization” (Samuelson, Negishi) Maximization of weighted utility function: Outcome of efficient competitive market (however complex but finite time) = 2. This allows us (in principle) to calculate the outcome of a market system by a constrained non-linear maximization.
How do we solve IA models? The structure of the models is the following: We solve using various mathematical optimization techniques. • GAMS solver (proprietary). This takes the problem and solves it using linear programming (LP) through successive steps. It is extremely reliable. • Use EXCEL solver. This is available with standard EXCEL and uses various numerical techniques. It is not 100% reliable for difficult or complex problems. • MATHLAB. Useful if you know it. • Genetic algorithms. Some like these.
Can also calculate the “shadow prices,” here the efficient carbon taxes Remember that in a constrained optimization (Lagrangean), the multipliers have the interpretation of d[Objective Function]/dX. So, in this problem, interpretation is MC of emissions reduction. Optimization programs (particularly LP) will generate the shadow prices of carbon emissions in the optimal path. For example, if we look at the DICE model, the carbon shadow price might be $30 per ton carbon ($7 per ton CO2)
Applications of IA Models I will give an example that compares different policies and scenarios. 1. No controls ("baseline"). No emissions controls. 2. Optimal policy. Emissions and carbon prices set for economic optimum. 3. Various international agreements (Strong Kyoto ≈ Obama proposals and Copenhagen Accord) For these, I will use latest modeling results (RICE-2010, Nordhaus, PNAS, 2010).
Emissions Trajectories for RICE-2010 Source: Nordhaus, “Economics of Copenhagen Accord,” PNAS (US), 2010.
IPCC AR4 Model Results: History and Projections RICE-2010 model
Policy outcomes variables Overall evaluation Two major policy variables are - emissions with controls - carbon tax
Carbon prices for major scenarios Source: Nordhaus, “Economics of Copenhagen Accord,” PNAS (US), 2010.
Where are we today? Actual equivalent global carbon price = $1 / tCO2 30 30