Download

1 / 24
250 likes | 263 Vues
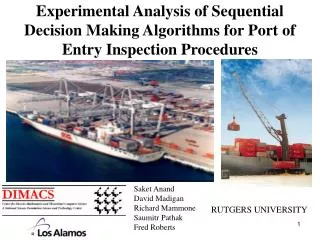
Develop algorithms to intercept illicit nuclear materials and weapons in maritime transportation, minimizing false positives and delays.

E N D
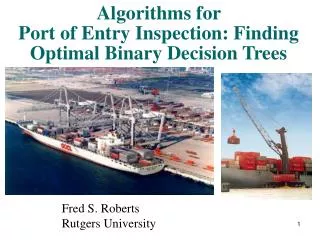
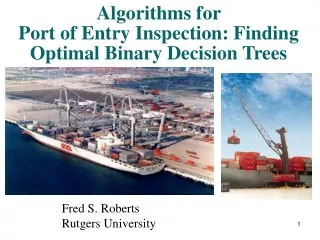
Decision Support Algorithms for Port of Entry Inspection Fred S. Roberts DIMACS Center, Rutgers University In collaboration with Los Alamos National Laboratory Preliminary Support: Office of Naval Research
Port of Entry Inspection Algorithms • Goal: Find ways to intercept illicit • nuclear materials and weapons • destined for the U.S. via the • maritime transportation system • Currently inspecting only small • % of containers arriving at ports • Even inspecting 8% of containers in Port of NY/NJ might bring international trade to a halt (Larrabbee 2002)
Aim: Develop decision support algorithms that will help us to “optimally” intercept illicit materials and weapons subject to limits on delays, manpower, and equipment • Find inspection schemes that minimize total “cost” including “cost” of false positives and false negatives Port of Entry Inspection Algorithms Mobile Vacis: truck-mounted gamma ray imaging system
Stream of containers arrives at a port • The Decision Maker’s Problem: • Which to inspect? • Which inspections next based on previous results? • Approach: • “decision logics” • combinatorial optimization methods • Builds on ideas of Stroud • and Saeger at LANL • Need for new models • and methods Sequential Decision Making Problem
Containersarriving to be classified into categories. • Simple case: 0 = “ok”, 1 = “suspicious” • Inspection scheme: specifies which inspections are to be made based on previous observations Sequential Decision Making Problem
Containers have attributes, each in a number of states • Sample attributes: • Does ship’s manifest set off an “alarm”? • What is the neutron or Gamma emission count? Is it above threshold? • Does a radiograph image come up positive? • Does an induced fission test come up positive? Sequential Decision Making Problem Gamma ray detector
Simplest Case: Attributes are in state 0 or 1 • Then: Container is a binary string like 011001 • So: Classification is a decision function F that assigns each binary string to a category. Sequential Decision Making Problem 011001 F(011001) If attributes 2, 3, and 6 are present, assign container to category F(011001).
If there are two categories, 0 and 1, decision function F is a boolean function. • Example: • F(000) = F(111) = 1, F(abc) = 0 otherwise • This classifies a container as positive iff it has none of the attributes or all of them. Sequential Decision Making Problem 1 =
Sequential Decision Making Problem • Given a container, test its attributes until know enough to calculate the value of F. • An inspection scheme tells us in which order to test the attributes to minimize cost. • Even this simplified problem is hard computationally. Hard Questions
Sensors measure presence/absence of attributes. • Binary Decision Tree: • Nodes are sensors or categories (0 or 1) • Two arcs exit from each sensor node, labeled left and right. • Take the right arc when sensor says the attribute is present, left arc otherwise Binary Decision Tree Approach
Reach category 1 from the root only through the path a0 to a1 to 1. • Container is classified in category 1 iff it has both attributes a0 and a1. • Corresponding boolean function F(11) = 1, F(10) = F(01) = F(00) = 0. Binary Decision Tree Approach Figure 1
Reach category 1 from the root by: • a0 L to a1 R a2 R 1 or • a0 R a2 R1 • Container classified in category 1 iff it has • a1 and a2 and not a0 or • a0 and a2 and possibly a1. • Corresponding boolean function F(111) = F(101) = F(011) = 1, F(abc) = 0 otherwise. Binary Decision Tree Approach Figure 2
This binary decision tree corresponds to the same boolean function • F(111) = F(101) = F(011) = 1, F(abc) = 0 otherwise. • However,it has one less observation node ai. So, it is more efficient if all observations are equally costly and equally likely. Binary Decision Tree Approach Figure 3
Even if the boolean function F is fixed, the problem of finding the “optimal” binary decision tree for it is very hard (NP-complete). • For small n = number of attributes, can try to solve it by brute force enumeration. • Even for n = 4, not practical. (n = 4 at Port of Long Beach-Los Angeles) Binary Decision Tree Approach Port of Long Beach
Promising Approaches: • Heuristic algorithms, approximations to optimal. • Special assumptions about the boolean function F. • Example: For “monotone” boolean functions, integer programming formulations give promising heuristics. Binary Decision Tree Approach
Cost Functions • Above analysis: Only uses number of sensors • Using a sensor has a cost: • Unit cost of inspecting one item with it • Fixed cost of purchasing and deploying it • Delay cost from queuing up at the sensor station • Unit Cost Complication: How many nodes of the decision tree are actually visited during average container’s inspection? Depends on “distribution” of containers.
Cost Functions: Delay Costs • Stochastic process of containers arriving • Distribution of delay times for inspections • Use queuing theory to find average delay times under different models
Cost Functions • Cost of false positive: Cost of additional tests. • If it means opening the container, it’s very expensive. • Cost of false negative: Complex issue.
One Approach to False Positives/Negatives and Sensor Errors: Modeling Sensor Operation • Threshold Model: • Sensors have different discriminating power • Many use counts • See if count exceeds • threshold Cost Functions
Threshold Model: • Sensor discriminating power K, threshold T • Attribute present if counts exceed T • Calculate fraction of objects in each category whose readings exceed T • Seek threshold values that minimize all costs: inspection, false positive/negative • Simulation approach Cost Functions Mathematical modeling
Complications • Sensor errors – • probabilistic approach • More than two values of an attribute (present, absent, present with probability > 75%, etc.) • Inferring the boolean function from observations (partially defined boolean functions)
Machine learning approaches are promising: • Bayesian binary regression • Splitting strategies • Pruning learned decision trees Complications
Research Team • Endre Boros, Rutgers, Operations Research • Elsayed Elsayed, Rutgers, Industrial and Systems Engineering • Paul Kantor, Rutgers, School of Information and Library Studies • Sallie Keller-McNulty, Los Alamos, Statistical Sciences Group • Alex Kogan, Rutgers, Business School • Paul Lioy, Rutgers/UMDNJ, Environmental and Occupational Health and Sciences Institute • David Madigan, Rutgers, Statistics • Richard Mammone, Rutgers, Center for Advanced Information Processing • S. Muthukrishnan, Rutgers, Computer Science • Feng Pan, Los Alamos, Energy and Infrastructure Analysis Group • Richard Picard, Los Alamos, Statistical Sciences Group • Fred Roberts, Rutgers, DIMACS Center • Kevin Saeger, Los Alamos, Homeland Security • Phillip Stroud, Los Alamos, Systems Engineering and Integration Group
For Further Information • Fred Roberts • Director of DIMACS • http://dimacs.rutgers.edu/ • Chair, Rutgers University Homeland Security Research Initiative http://dimacs.rutgers.edu/RUHSRI/ • Co-chair, New Jersey Universities Homeland Security Research Consortium http://dimacs.rutgers.edu/NJHSConsortium/