Download
1 / 12
140 likes | 384 Vues
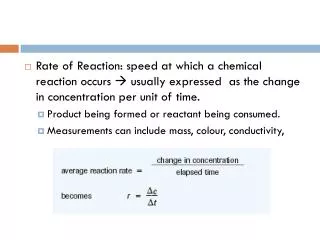
Theories of Reaction Rates. Rates of Chemical Reactions. Beyond Collision Theory. For a collision to be effective, it must satisfy both of these criteria: 1. Correct orientation of reactants 2. Sufficient collision energy. Orientation of Reactants.

E N D
Theories of Reaction Rates Rates of Chemical Reactions
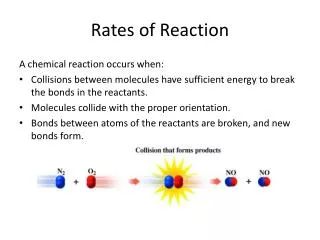
Beyond Collision Theory • For a collision to be effective, it must satisfy both of these criteria: • 1. Correct orientation of reactants • 2. Sufficient collision energy
Orientation of Reactants • Reactants must have the correct collision geometry. • If they do not, the reaction will be unable to proceed.
Activation Energy • The activation energy (Ea) of a reaction is the minimum collision energy that is required for a successful reaction. • The collision energy depends on the total kinetic energy of the colliding particles.
Activation Energy • Notice the following on the graph: • 1. At either temperature, only a small fraction of collisions have sufficient kinetic energy (Ea) to result in a reaction. • 2. As the temperature of a sample increases, the fraction of collisions with sufficient energy increases significantly.
Transition State Theory • This is a theory that is used to predict what happens when molecules collide in a reaction. • Essentially, it shows how a molecule’s kinetic energy is converted to potential energy when it collides with another reactant. • This can all be shown using potential energy diagrams. • Remember that there is no way to predict the activation energy of a reaction from its enthalpy change.
Potential Energy Diagrams • The top curve on a potential energy diagram represents the transition state. The type of molecule that exists at the transition state is known as the activated complex. • The activated complex is a transitional species that is neither product nor reactant and is highly unstable.
Drawing a Potential Energy Diagram • Carbon monoxide reacts with nitrogen dioxide to form carbon dioxide and nitric oxide (NO). Draw a potential energy diagram to illustrate the progress of the reaction. Label the axes, the transition state, and the activated complex. Indicate the activation energy of the forward reaction Ea(fwd) = 134kJ, as well as ∆H = -226kJ. Calculate the activation energy of the reverse reaction, Ea(rev), and show it on the graph.
Homework • Practice Problems 13, 14, and 16 on page 294 • Section review: #3, 6, and 7 on page 296