Download
1 / 39
390 likes | 508 Vues
Energy Accounting and Need for Special Energy Meters under ABT Regime. Energy Account. The energy accounting closely monitors the energy flow within and beyond the organisation, and also to help identify areas where system efficiencies can be improved.

E N D
Energy Accountingand Need for Special Energy Metersunder ABT Regime
Energy Account • The energy accounting closely monitors the energy flow within and beyond the organisation, and also to help identify areas where system efficiencies can be improved. • It provides reports on the energy losses at each level of the transmission and distribution network, and within specific geographical regions. • It also helps identify long- and short-term strategic management trends. • To be FAIR and EQUITABLE • To RECOVER DUES at the EARLIEST (Billing Cycle) • TRANSPERANCY • Dispute Resolution • Reconciliation
Capacity charge: Capacity charge is based on Annual Fixed Charge and will be related to availability of generating station. Availability means the readiness of the generating station to deliver ex-bus output expressed as a percentage of its rated ex-bus output capability. Energy charge: Energy charge is related to the scheduled ex-bus energy to be sent out from the generating station and will be worked out on the basis of paise per KWh.
AVAILABILITY TARIFF(ABT) (a) CAPACITY CHARGE (b) ENERGY CHARGE • ADJUSTMENT FOR DEVIATIONS (UI CHARGE) • = a function of Ex-bus MW availability of power plant for the day declared before the day starts x SEB’s % share . • = MWh for the day as per ex=bus drawl schedule for the SEB finalized before the day starts x Energy charge rate • =Σ(Actual energy interchange in a 15 min time block – scheduled energy interchange for the time block) x UI rate for the time block. TOTAL PAYMENT FOR THE DAY = (a) + (b)± ( c)
SETTLEMENT SYSTEM For the day: 0000 hrs. to 2400 hrs. Central Generating Stations 1 2 3 Ex-Bus Capability x1 x2 x3 (Forecast) ____ ___ ___ SEB-A’s share a1 a2 a3 SEB-B’s share b1 b2 b3 SEB-C’s share c1 c2 c3 For a particular 15 minute time block SEB-A’s requisition a’1 a’2 a’3 SEB-B’s requisition b’1 b’2 b’3 SEB-C’s requisition c’1 c’2 c’3 ___ ___ ___ CGS’s schedule x1’ x2’ x3’ MW SRLDC/Comml/IEGC/37
SETTLEMENT SYSTEM Total capacity charge payable to CGS-1 for the day = x1 * capacity charge rate of CGS-1 Total Energy charge payable to CGS-1 for the day = x1’ * Energy charge rate of CGS-1 4 Total capacity charge payable by SEB-A for the day = a1 * capacity charge rate of CGS-1 + a2 * -do- CGS-2 + a3 * -do- CGS-3 Total Energy charge payable by SEB-A for the day = (a1’) * Energy charge rate of CGS-1 ( 4 ) + (a2’) * -do- CGS-2 ( 4 ) + (a3’) * -do- CGS-3 ( 4 ) All capacity charge and Energy charge payments to be made by SEBs directly to CGS. SRLDC/Comml/IEGC/38
SETTLEMENT SYSTEM Actual (metered) injection of CGS-1 in the time block = X1MWh. Excess injection = (X1 – x1’ ) MWh. 4 Amount payable to CGS-1 for this =(X1-x1’) * pool price for the block. 4 SEB-A’s scheduled drawl for time block = a1’+a2’+a3’ = a’ MW (ex-CGS Bus) SEB-A’s NET drawal schedule = (a’ – Notional Transm. Loss) MW = (a’ – Notional Transm. Loss)= A’ MWH 4 Actual (metered) net drawal of SEB-A during time block = A MWH Excess drawal by SEB-A = (A-A’) MWh. Amount payable by SEB-A for this = (A-A’) * pool price for the block. All above payments for deviations from schedules to be routed through a pool A/C operated by RLDC SRLDC/Comml/IEGC/39
AVAILABILITY • Availability in relation to a generating station for any period means the average of the DCs for all the days during that period expressed as a percentage of the installed capacity of generating station minus normative auxiliary consumption in MW and shall be computed as per the following formula:
Present Definition Capacity charges N DCi/ {NxICx(100-Auxn) }% % Availability = 10000 i=1 Where DCi = Average Declared Capacity for i th day of the period in MW N = Total no. of days during the period Auxn = Normative Auxiliary Consumption as % of gross Gen. IC= installed capacity in MW % Availability forms the basis for calculations N PLF = SGi/ {NxICx(100-Auxn) }% 10000 i=1
Recovery of Annual fixed charges 100% recovery if % Availability >=Target Availability Pro-rata reduction if %Avb<T.Avb. Target Availability For Fixed charges recovery Target PLF for incentive Both to be Notified by CERC Financial Year forms the basis for calculations ISGS Target Availabilty Target PLF RSTPS 80% 80% NLC 75% 75%
Monthly Capacity charges receivable by an ISGS:1 st Month = (1xACC1)122 nd Month = (2xACC2-1ACC1)12….….12 th month = (12xACC12-11ACC11)12where ACC1,ACC2…….ACC12 = Annual capacity charges corresponding to the cum. Availability up to the corresponding month. Monthly Capacity charges payable by a beneficiary :1 st Month = (1xACC1xWB1)122 nd Month = (2xACC2xWB2-1ACC1xWB1)12….….12 th month = (12xACC12xWB12-11xACC11xWB11)12where WB1,WB2…..WB12 = Weighted average % share up to the corresponding month.
The Energy Charges Payable by beneficiary to the ISGS = Variable Charge of ISGS X Requisition of beneficiary from The ISGS The Energy Charges Receivable by ISGS from beneficiaries = Variable Charge of ISGS X Despatch schedule of ISGS Energy charges
Incentive as per existing norms • Flat rate of 25ps/u • For ex-bus Schedule Energy in Excess of ex-bus energy corresponding to Target PLF
Settlement Systems* • On weekly basis : • For seven day period ending on penultimate Sunday • RLDC to furnish Scheduling & Metering data to REB • Sectt. by Thursday noon • REB Sectt. to issue Weekly UI a/c by Tuesday • Pool a/c operated by RLDC • Settlement for UI on weekly basis • All accounts open for 20 days SRLDC/Comml/IEGC/34
Settlement System contd.. • On monthly basis : • REB to issue REA specifying % Avb, % Net Entitlement, % Energy charges, Wt. Avg. Ent. for Tr. Ch. etc. • Capacity and Energy Charges, Incentive etc. • –billed directly by ISGS based on REA issued by REB
WEEKLY ENERGY ACCOUNTING: WEEKLY CYCLE : 00 HRS OF EACH MONDAY TO 24 HRS; OF THE THE FOLLOWING SUNDAY ACTIVITIES MONDAY MORNING : SEM DATA DOWNLOADED TO DCD : DCD DATA LOADED TO A LOCAL PC : DATA SENT TO RLDC via E-MAIL (LATEST TUESDAY MORNING ) THURSDAY NOON : RLDC CONVEYS PROCESSED DATA TO REB Tues day : WEEKLY UI a/c & Reactive charges issued BY REB BILLING Cap. Charge : BILLED MONTHLY based on DAILY DC BY ISGS ENERGY CHARGE : BILLED MONTHLY based on DAILY DRAWL SCHEDULES ISSUED BY RLDC UI a/c Paid/Disbursed as per UI a/c issued by REB REACTIVE a/c
Unscheduled Interchanges (UI) Variations in actual generation/drawal and scheduled generation /drawal are accounted through UI. This is a frequency linked charge which is worked out for each 15 minute time block. Charges for all UI transaction, based on average frequency have following rate of paise per KWh from 01.01.03 upto 31.03.04. UI rate (Paise per KWh) Average Frequency of time block 50.5 Hz. and above 0.0 Below 50.5 Hz. and upto 50.48 Hz. 5.6 Below 49.04 Hz. and upto 49.02 Hz. 414.4 Below 49.02 Hz. 420.0 Between 50.5 Hz. and 49.02 Hz. Linear in 0.02 Hz. step
Present UI rate UI rate (Paise per KWh)Average Frequency of time block (Hz,) Below Not below ----- 50.50 0.050.50 50.48 6.050.48 50.46 12.0----- ----- ---------- ----- ----- 49.84 49.82 204.049.82 49.80 210.049.80 49.78 219.049.78 49.76 228.0----- ----- ----- 49.52 49.50 345.0 49.50 49.48 329.0 ----- ----- ----- 49.04 49.02 729.049.02 ----- 745 (Each 0.02 Hz. Step is equivalent to 6.0 paise/kWh in the 50.5-49.8 Hz. Frequency range and to 9.0 paise/kWh in the 49.8-49.5 Hz. Frequency range and to 16.0 paise/kWh in the 49.5-49.0 Hz. Frequency range).
Under drawl by SEB-A Over Gen. By ISGS-1 UI import from IR-1 Regional Pool System frequency UI Rate Under gen. By ISGS-2 UI Export to IR-2 Over drawl by SEB-B No one to onecorrespondence Energy transactions of UI from/to Pool
Operation of Pool Separate Pool a/cs operated by RLDCs on behalf of REBs for UI, IRE and Reactive charges Payable by SEB-B Payable by IR-2 at its UI rate Payable by ISGS-2 Regional Pool Receivable by ISGS-1 (up to DC) Receivable by IR-1 at its UI rate Receivable by SEB-A No one to one correspondence No cross adjustments allowed between the constituents
Where do SEMs come into picture? • Only measuring Deviations from Schedule i.e. UI • To measure 15 min block-wise Energy and Frequency Issues concerned : -Specifications -Location criterion -Main/Check/Standby philosophy
Metering Philosophy under ABT regime NTPC Station Aux. Aux. Aux. M2 M1 B A C D E C1 C2 ISGS -I H S2 G S1 F F' J J' K K' L M SEB-A ISTS S T U W V N O P SEB-B R ISTS Q SEB-B SEB-A ISGS-II injection Main = (M1+M2) Check=(C1+C2) Standby = (S1+S2) X SEB-A MainMeter Y StandbyMeter CheckMeter Other than NTPC Station ISGS -II ISTS ISGS-I injection Main = (F+G+H+J+K) Check=(F'+L+M+J'+K') Standby = (A+B+C+D+E) SEB-B drawal Main = (T+U+X) Standby = (V+W+Y) SEB-A drawal Main = (G+H+N+O+Y) Standby = (L+M+Q+R+X)
Points for Energy Accounting Injection by NTPC Generating Stations : Main &check meters on Outgoing feeders Standby meters on HV side of GT/TT Injection by other Generating Stations : Main &check meters on HV side of GT/TT Standby meters on Outgoing feeders Drawl by SEBs Main -HV side of ICTs at GS and CTU S/S, Receiving end of Lines directly connected to ISGS Respective ends of Lines connected to other SEBs Standby – LV/ Tertiary side of ICTs Other end of lines connected to other SEBs
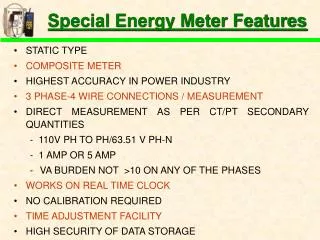
Special Energy Meter Features STATIC TYPE COMPOSITE METER HIGHEST ACCURACY IN POWER INDUSTRY 3 PHASE-4 WIRE CONNECTIONS / MEASUREMENT DIRECT MEASUREMENT AS PER CT/PT SECONDARY QUANTITIES - 110V PH TO PH/63.51 V PH-N - 1 AMP OR 5 AMP VA BURDEN NOT >10 ON ANY OF THE PHASES WORKS ON REAL TIME CLOCK NO CALIBRATION REQUIRED TIME ADJUSTMENT FACILITY HIGH SECURITY OF DATA STORAGE
Raw data WEEK FROM 0000 HRS OF 06-01-01 TO 0837 HRS OF 15-01-01 NP-0185-A 91858.5 99968.5 39195.5 06-01-01 00 51 +21.57 48 +21.68 50 +21.71 49 +21.33 …. 04 19 +20.61 23 +20.80 19 +21.05 00 +21.35 … 08 00 +24.95 00 +24.95 00 +25.09 00 +24.38 … 12 71 +24.38 52 +23.98 30 +23.81 13 +24.03 … 16 00 +23.37 00 +23.52 00 +22.87 00 +21.66 … 20 00 +25.75 00 +25.32 00 +25.40 00 +25.37 … NP-0185-A 94117.2 99968.5 40313.5 07-01-01 00 59 +20.94 54 +21.01 59 +20.79 58 +21.05 … 04 33 +20.05 38 +20.17 37 +20.49 28 +20.90 … 08 00 +22.99 06 +23.10 00 +22.81 00 +22.94 … 12 85 +20.93 51 +20.65 21 +20.79 00 +19.89 … 16 07 +20.14 01 +20.53 00 +20.72 00 +20.66 … 20 05 +23.62 08 +23.23 16 +23.25 27 +23.40 … NP-0185-A 96172.2 99968.5 41236.9 08-01-01
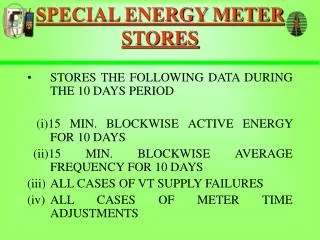
Special Energy Meter Various Checks CHECKS for DATA VALIDATION : • NOMINAL VOLTAGE CHECK • FREQUENCY • TIME CORRECTION • WATTHOUR CHECK • PREVIOUS WEEK DATA • ALGEBRAIC SUM
Special Energy Meter Data Computing • RAW DATA IN WHr • MWhr = RAW DATA x CT RATIO x PT RATIO • PAIR CHECK DONE FOR MAIN/ CHECK/ STANDBY/ FICTMETERS ( ex. : for both sides of ICTs, Lines, GT side & Line side at ISGS.
Reactive Energy Accounting Reactive Energy is measuredwhen system voltage is > 103% of Nominal Voltage< 97% of Nominal Voltage
Loss computations 15 min block-wise % loss = (Sum of all Injections from ISGS + net IR imports) - (Sum of Drawals by all beneficiaries from Central Grid) X 100 (Sum of all Injections from ISGS + net IR imports)
Use of Notional Loss in scheduling • % Average loss (15 min. blockwise) aggregated over the last week will be used in Scheduling Process for the next week. (for arriving at the ex-periphery Drawal Schedules of Beneficiaries) • 0.5% REDUCTION MEANS MORE THAN 100 CR ANNUAL SAVINGS
TYPICAL %AVERAGE LOSS FIGURES FOR CENTRAL GRID IN SR OTHER REGIONS %Average losses In other Regions : NR 3.5 to 4.5 ER 3.0 to 3.5 WR 5.0 to 6.0
REACTIVE ENERGY CHARGE : PAYABLE FOR : 1. VAR DRAWALS AT VOLTAGES BELOW 97% • VAR INJECTION AT VOLTAGES ABOVE 103% RECEIVABLE FOR: 1. VAR INJECTION AT VOLTAGES BELOW 97% • VAR DRAWAL AT VOLTAGES ABOVE 103% APPLIED FOR VAR EXCHANGES BETWEEN : A) BENEFICIARY SYSTEM AND ISTS - THROUGH A POOL ACCOUNT B) TWO BENEFICIARY SYSTEMS ON INTER-STATE TIES - BY THEMSELVES RATE: @ Rs. 51.05/MVArh (for 205-06) Basic Rate : 4 paise/kvArh ( for the year 2000-01 ) 5% ESCALATION PER YEAR
Issues in Reactive Energy charges • Deficit in pool (SR & ER) -due to continuous High voltages in SR Surplus in Pool (NR &WR) Utilization of Accruals Disputes in payments between Beneficiaries for Reactive charges in Inter-state Lines
SOUTHERN REGIONAL ELECTRICITY BOARD ABT based U.I. Account FOR A TYPICAL WEEK NNOTE: 1.MAPS & KGS not covered under ABT; hence UI reduced to zero, under all conditions .IR Exchanges: - Metering points – For WR it is Chandrapur South Bus. - For ER it is Gazuwaka East Bus & Talcher stage I&II interconnecting bus. ii) UI for IR exchanges with ER has been calculated at ER frequency. iii)UI charges with WR and ER has been taken as first charge, as per decision taken in Special Committee meeting held on 17.12.2002.
A.ABSTRACT OF UNSCHEDULED INTERCHANGES ( UI figures in Rs. Lakhs) Utilities UI Payable Utilities UI Receivable KPTCL 720.47741 TNEB 641.48459 KSEB 457.19673 APTRANSCO 269.73260 PONDY 124.38710 ER 188.40533 NLC_II_2 14.72798 RSTPS 84.30154 NLC_II_1 13.81846 GOA 10.67606 TALCHER_II 2.36108 NLC_I_EXP 2.25996 WR 1.32476 TOTAL 1332.96876 TOTAL 1198.18484
A.ABSTRACT OF UNSCHEDULED INTERCHANGES (restricting to the lesser of the two as per the 126th SRE Board decision). (UI figures in Rs. Lakhs) Utilities UI Payable Utilities UI Receivable KPTCL 647.62591 TNEB 641.48459 KSEB 410.96701 APTRANSCO 269.73260 PONDY 111.80962 ER 188.40533 NLC_II_2 13.23876 RSTPS 84.30154 NLC_II_1 12.42120 GOA 10.67606 TALCHER_II 2.12234 NLC_I_EXP 2.25996 WR 1.32476 TOTAL 1198.18484 TOTAL 1198.18484