Download
1 / 67
700 likes | 1.01k Vues
Heavy Metals in Organic Agriculture. Martha Rosemeyer Ecological Agriculture February 27, 2004. Why are heavy metals impt in org ag?. Use of high heavy metal containing wastes in fertilizers, esp. micronutrient fertilizers Sewage sludge application, current or past

E N D
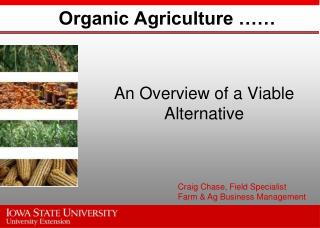
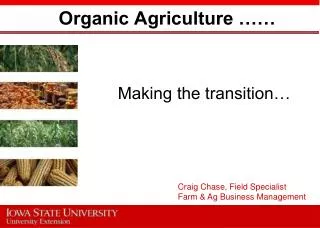
Heavy Metals in Organic Agriculture Martha Rosemeyer Ecological Agriculture February 27, 2004
Why are heavy metals impt in org ag? • Use of high heavy metal containing wastes in fertilizers, esp. micronutrient fertilizers • Sewage sludge application, current or past • Smelter emissions and trash incineration on land • Use of fish fertilizers (mercury) • Use of lead arsenate pesticide on orchards in W WA and conversion to other crops and developed land* • Use of high Cd, Pb containing rock phosphate • Use of CCA treated fence posts
Figure 18.19 Copper smelter in Anaconda, Montana
Major points • Heavy metals are (almost) forever • Heavy metals are being concentrated and spread in the environment increasing human and animal contact • There are methods to manage them as long as there is vigilance for the next millennia (!) • There is some bioremediation • Systems thinking is critical to solving environmental problems
Outline • What are heavy metals? • How are they bound to the soil • Food chain • Plant uptake of heavy metals • Animal uptake • Reducing heavy metal contamination
What is a heavy metal? • Loose definition- specific density > 4-7 g/cm3 • Usually associated with toxicity in plants (but some micronutrients produce toxicity symptoms as well) or animals • “trace metal” metals in ppm concentrations in earth’s crust
How’d they get into the soil? • Most in deposits in earth where safe • Generally natural low levels in soil • By mining, smelting and concentrating metals they have become more toxic to the biosphere • Have spread where humans come into contact with them • “The toxicity of inorganic contaminants released into the environment every year is now estimated to exceed that from radioactive and organic sources combined. A fair share goes to contaminating soil. ”--Brady and Weil 2000, p818
Some heavy metals and their environmental and physiological effects * * * * Brady and Weil, 1999 Canadian HM in soil stds also consider others Co, Mo, not Cr!
The Fertilizer Loophole in 1976 RCRA- Reduce, Recycle, Reuse • Toxic waste can be called “fertilizer” if it includes 1% or more of a plant nutrient, or “liming material” if it is alkaline. Regulators only check for the labeled chemicals.
Some industrial wastes with arsenic, cadmium, lead, mercury, dioxins, etc., are “recycled” through ordinary fertilizer without testing, standards or disclosure. Wilson 2002
Materials: Industrial ashes Acids Slag Tailings Industries: Steel Copper Brass Galvanizing Electronics Chemicals Mining Cement kiln Gypsum Nuclear Coal combustion Wastes in Fertilizers Duff Wilson 2002
Government and industry • For government • Dual role: regulation and promotion • Dilution is the solution to pollution • For industry • Save money on waste disposal • Save money on raw material for fertilizer • It’s legal. Topsoil has become the legal repository for wastes no longer allowed as emissions to air or water Wilson 2002
Reduction of HM in sewage sludge 1976 to 1990 Brady and Weil, 2000
Limits in sewage sludge and metal additions for WA 0.33 Wa 0.089 Wa 0.022 Wa 2.2 Wa Brady and Weil, 2000 and Labno,2001
Soil applied sewage sludge: Pb stays in soil, all others 40-60% lost (20-80%?) Brady and Weil, 2000
Four heavy metals • Mercury (Hg) • As (Arsenic) • Pb (Lead) • Cd (Cadmium)
Mercury (Hg) ppm • Background level • ~0.03 U.S. agricultural soils • 0.07 Washington state • Products • 12 Ironite • 3 granular zinc • 1.8 Terrene-Greens • 0.6 NuLife • Found in fish emulsion, bioaccumulated from Hg in waste and from burning coal Source: Wash. Dept. of Agriculture Duff Wilson 2002
Arsenic: Source • Has been used for centuries (China 900 AD) • Many different forms of arsenate (200),e.g CaAs • Form influences mobility and toxicity • Mined with other minerals esp. Au, Cu, Sn and mined, from mine waste or tailings • Natural or mine waste in water • Found in hydrothemal deposits
As- sources and background levels • Occurs naturally in soil and water (may be toxic in water, e.g. Bangladesh and India) • High As in upper end of Cascade Valleys in WA, may be high in volcanic soils and hot springs • Present in coal burning and dusts from cement manufacture • Smelter- especially within one mile • Sprayed in WA state as insecticide on apples for codling moth until 1950, forest thinning to 1960s • May be near Chromated Copper Aresenate treated timber- get $25 test kit from Environmental Working Group
Arsenic (As) ppm • Background level • ~6 U.S. agricultural soils • 7 Washington state • Products • 4,400 Ironite • 989 Boronat • 86 Nulife • 48 Nutrilime • 18 Diammonium phosphates
Arsenic and human health • Food and water major source of exposure for US citizens (NewYorkTimes) • High concentrations: Internal bleeding and death • Known to cause cancer: lung, skin, liver, kidney; reproductive damage • Causes arsenic keratosis of skin
As- regulation • Permissible level in water (Bush changed to WHO levels of .01 ppm)- 0.01 ppm • Permissible level in soil in out-of-print WSU extension bulletin states: 25 mg/kg (ppm) is ‘probably not affecting plant growth’ • Residential soil cleanup - 250 mg/kg • Children should be < 37 ppm, adults with occasional exposure to 175 mg/kg acceptable • Chronic exposure is of concern, e.g in gardening • Symptoms in humans depend on individual susceptibility, form of As in soil, difficult to predict
As behavior in soil and plants • Background level in soil • ~6 ppm U.S. agricultural soils, but 7 Washington state • Vashon-Maury Soil samples 2.3 - 460ppm (<2mm sieved) • More soluble and mobile in soil than Pb, so may have leached, increases in flooded, wet soils • Redistributed through tillage, but usually only in subsoil if soil is sandy • If high phosphate in soil may displace As to leach • As in soil can be 10-1000x higher in soil than plant • Can be high enough to stunt plants and reduce yield-- binds to energy exchange apparatus
Lead (Pb) • Sources of lead in soil include: former roadways <100ft., PbAs pesticide, smelter, within 20 ft of buildings, < 1 mile for smelter or fossil fuel electrical power plants or cement manufacturing • Background level in soil in ppm • 11 U.S. agricultural soils • 17 Washington state, • Vashon-Maury Island 5.3-1300ppm • Lead in soil usually not high enough to affect the plant growth because highly bound to the soil unless pH is low (acid)
Lead (Pb) ppm • Fertilizer Products that contain lead • 29,400 Frit Industries • 20,000 Bay Zinc • 2,770 Ironite • 2,491 NuLife • 350 Nutrilime • 153 Terrene-Greens Natural Organic • 140 Vigoro
Cadmium (Cd) ppm • Background level • 0.2 ppm U.S. agricultural soils • 1 ppm Washington state • 0-15ppm Vashon-Maury soil samples • Cadmium in wheat grain related to soil salinity, esp. chlorides, uptake as CdCl • Fertilizer Products • 4,506 Whatcom Farmers Co-op • 739 wood ash • 500 Stoller • 275 Blu-Min Zinc • 153 DAP • 101 Ortho Superphosphate • 97 Walt’s Organic
Cadmium- health effects and regs • Health effects: carcinogen (respiratory and testicular, pancreatic cancer), • reproductive toxin: reduced birthrate, premature birth, stillbirth and spontaneous abortion • Behavioral and learning disabilities • Regulation: air 0.05 g/day (1/10th that of Pb) • Soil maximum: 4 ppm Cd (Wa and Canada, FRA 1997)
Cd- Sources of exposure • Food- major source of non-occupational exposure, esp. wheat and potatoes • Incineration- 71% Pb and 88% Cd due to plastics (vinyland other) in waste stream • Cd in fertilizer and food is regulated much more strictly by Canadians and Europeans • Now same as Canada 4 kg/ha max acceptable cumulative addition, 0.089 kg/ha max annual addition (Fert. Reg Act 1997) • Canada and Aust. have fertilizer “truth in labeling”
Cd has increased in soils due to P fertilizer use • In Columbia basin and around the world where high Cd P is applied-- even where low Cd P is applied • 10% in exchangeable pool in Canadian prairie vs. 1% in Brady and Weil! • Concentrated on clays and organic matter
Phosphate fertilizers as source of Cd, Pb, As: Western states to 340 mg/kg Cd J.R. Simplot’s phosphate mine near ID/WY border
Heavy metals in the food chain:soil to plant Brady and Weil, 2000
International Pb and Cd limits in foods-- no established US limits Labno 2001
Message • Exact relationship between soil and plant depends on soil type, climate, management, chemical form, plant species and variety • It is complicated and data is lacking • Other countries have been able to regulate despite this-- why not US?
Uptake of HM by corn from sewage sludge * * not true in wheat Brady and Weil, 2000
Species dependent where it accumulates • Greater accumulation of Pb and Cd in stover (what’s left after harvest) than wheat grain • Corn from previous table concerning corn grown with sewage sludge grain greater than stover
Patti Martin from Quincy WA is protagonist WA legislature creates database Finances research Lawsuit against EPA Duff Wilson’s expose
Cd and Pb uptake by wheat and potato WSU studies, Labno and Kuo 2001 • International Cd stds: grain 0.1 mg Cd/kg, tuber 0.05 mg Cd/kg (US mean 0.03 (.06 p 20)) • International stds for Pb: grain 0.35 mg Pb/kg, tuber 1.5 mg Pb/kg • Rates of application 1x, 2x, 8x for 2 years • Used 2 sources of DAP, TSP and RP, one Zn fertilizer • Used a low Cd waste-derived Zn fert. (application 0.1kg/ha/yr), Pb (5.6 kg/ha/yr at highest level), but results not reported for Cd
At the yr 1, 1x rate all grain and tubers except ID TSP were below international stds for Cd, 8x rate above for ID DAP and ID TSP (150ppm Cd) • At 1x and 8x application rate the levels in the grain and tuber were under Pb stds • Later study looked at Ironite and flue dust (676 mg Cd/kg, 180000 mg Pb/kg) but plant uptake was not performed. Previous study on uptake was performed with materials that were lower in Cd and Pb.
Cd from Triple Super P in grainNote in yr 2 all levels above stds Labno 2001
Cd in tuber yr 2 with TSP Close relationship between soil and plant levels of Cd (DTPA extractant) Labno, 2001
Where applied Cd goes Labno 2001
Message to legislators • “It was estimated that 1% of total soil Cd is in the wheat, indicating that most remains in the soil” Transfer coefficient = .01 • Transfer coefficient (Ratio of uptake over applied) was 0.005 for Pb indicating a low potential for plant uptake. • Transfer coefficient for As was small 0.012 indicating a low potential for plant uptake. • Report from Dept Ag based on Kuo’s student’s work, Dec 2001
Arsenic: Soil/plant relationship • Exact relationship between soil and plant depends on soil type, climate, management, chemical form, plant species and variety • Plant levels tends to increase until some level where plateaus • Significant on alkaline soils where have >10000 ppm (Bowell and Parshley) • As stunts or kills plants by acting as P and binding with energy transport mechanisms, green beans and legumes most sensitive -- --Peryea, 1999
Concentration of Pb and As in plants • Roots > leaves> fruits and seeds • Root skin is higher than inner flesh-- • Roots absorb but do not transport Pb • Apples and apricots contain low Pb and As • Haven’t found any regulations on As in food • Organic As may be less toxic than inorganic compounds of As; Organic As may be predominant in fruits and vegetables, although inorganic As more common in grain
Plant uptake Element Crop Uptake As Root crops Roots Cd Leafy veges Roots, tuber Grains, tuberleaves Lead Fruits, grains Surface or in tuber
Trends in food • FDA Market Basket Survey • a rough guide, aggregated • Lead, down • Cadmium, holding even • Arsenic, holding even • World Health Organization: Current levels are already a threat to people Duff Wilson 2002
Feds not moving to regulate (USDA or EPA), States regulation • Texas (1998) biosolids dose of 9 chemicals • Washington (1998): Canadian standards on 9 toxic chemicals – 45-year doubling dose • 63 product stop sales, 46 denied, 25 changed recommended application rates • 96% passed • Website:http://agr.wa.gov/PestFert/Fertilizers/ProductDatabase.htm • California (2002): ppm limits on 3 chemicals. Arsenic, 4-3-2. Cadmium, 6-5-4. Lead, 20 Duff Wilson 2002
Heavy metals in the food chain: Plants to animals Brady and Weil, 2000