Download

1 / 23
230 likes | 387 Vues
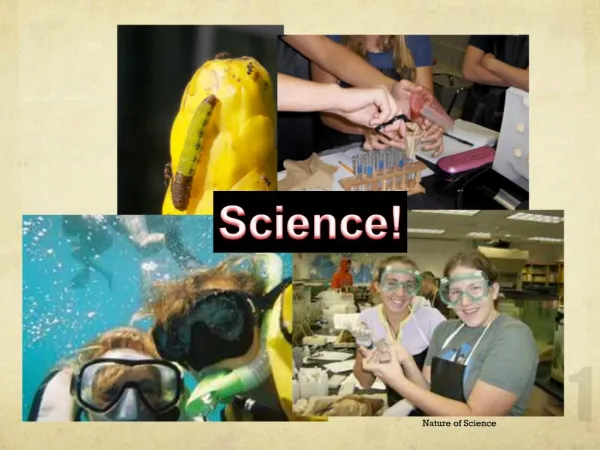
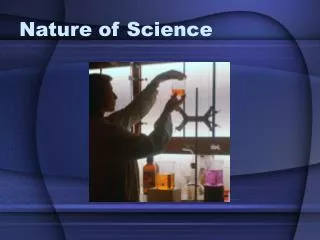
Nature of Science. Science. Facts and ideas developed by scientists and the methods used by scientists to gain information. A process of making observations and asking questions about those observations. Scientists gain knowledge through study and investigation. Observations.

E N D
Science • Facts and ideas developed by scientists and the methods used by scientists to gain information. • A process of making observations and asking questions about those observations. • Scientists gain knowledge through study and investigation.
Observations Data • recorded observations or any information acquired through experimentation • Types of Observations • Qualitative involves a description of the quality by using your senses • Quantitative involves the use of instruments; results are measureable; must include a number
Quantitative or Qualitative ? 1.It is about _____ centimeters in diameter. 2. The flame begins about 1-cm above the top of the candle. 3. The flame is a shade of blue at its base. 4. The length decreased during the observation period. 5. Immediately around the wick in a region about 1-cm wide and extending about 1-cm above the top of the wick, the flame is dark. 6. The amount of decrease was about _____ centimeters per half hour. 7. This dark region is roughly conical in shape. 8. The candle is translucent. 9. It is white (or yellow, etc.). 10. The flame has sharply defined sides but a ragged top.
Scientific Investigation • Scientific Method • Series of steps used to answer questions and solve problems • Traditional Steps of the Scientific Method • Identify the problem • Gather information • Make a hypothesis • Test the hypothesis by experimentation • Observe, Record Observations (Data) • Conclusion
Scientific Investigation Scientific investigations do not always proceed from one step of the scientific method to the next. Sometimes steps are skipped and sometimes they are repeated.
Experimental Design • Variable • a factor; item in an experiment which when changed causes the results of the experiment to change • Independent variable factor that is purposefully changed by the experimenter • Dependent variable factor that responds, therefore it is what is measured • Controlled variable constant; factor(s) that are kept the same throughout the experiment
Experimental Design • Testing Groups • Experimental Group • the test group where all conditions, except the independent variable,are kept the same • Control Group • the test group that is used as a standard for comparison; doesn’t include the independent variable
Example • Sam wished to investigate how fertilizer run-off affects the growth of algae in freshwater lakes and streams. He set his experiment up in this way. He placed 900 mL of water into each of five 1000 mL glass beakers. To each beaker he added 5 mL of water from an aquarium which contained a large concentration of algae. The beakers were placed under a grow light which was timed to provide 12 hours of light each day. Liquid fertilizer was added to the beakers in the following amounts: beaker 1 – no fertilizer, beaker 2 – 2 mL of fertilizer, beaker 3 – 4 mL of fertilizer, beaker 4 – 6 mL of fertilizer, beaker 5 – 8 mL of fertilizer. • Each week a random sample from each of the beakers was examined under a microscope to get a count of the number of algae cells present.
Dependent Variable • number of algae cells • Independent Variable • amount of fertilizer • Experimental Group • beakers with fertilizer (beakers #2-5) • Control Group • beaker without fertilizer ( beaker #1) • Controlled Variables • 900 mL of water • 5 mL of aquarium water • grow light for 12 hours • 1000 mL glass beakers
Example Stephanie conducted an experiment to determine if the color of a maze would affect the time it took for a mouse to run through it. She constructed 5 identical mazes of plywood. She painted them white, yellow, red, blue and green. She purchased 10 young mice at a local pet store. She ran 2 mice through each maze until the mice could run it twice without making an error, she then compare the number of runs it took the mice in each color to learn it
Dependent Variable • number of runs to learn maze • Independent Variable • color of maze • Experimental Group • mice running in colored maze • Control Group • mice running in white maze • Controlled Variables • age of mice • maze design
Example Researches want to determine the best temperature for storing batteries. Describe the following variables you need to consider when performing the experiment. Independent Variable Storage Temperature Dependent Variable hours of use after storage 2 Controlled Variables same type of battery same expiration date same moisture (environment)
Example • Your friend has to plan an experiment for a science fair. He asks for your help.His topic is “ The Strongest Cloth for Backpacks”. • Describe the following variables you need to consider when performing the experiment. • Independent Variable • type of fabric • Dependent Variable • how long fabric can carry heavy load without tearing • 3 Controlled Variables • size of fabric • initial condition of the fabric • load used
Example • Larry was told that a certain muscle cream was the newest thing on • the market and claims to double a person’s muscle power when • used as part of a muscle-building workout. Interested in this product, • he buys the special muscle cream and recruits Patrick and • SpongeBob to help him with an experiment. • Larry develops a specal marshmellow weight-lifting program for • Patrick and SpongeBob. He meets with them once every day for a • period of 2 weeks and keeps track of their results. Before each • session Patrick’s arms and back are lathered in the muscle cream, • while SpongeBob’s arms and back are lathered with the regular lotion.
Control Group SpongeBob Independent Variable Muscle Cream Dependent Variable Amount of Marshmellows lifted ( Strength) Controlled Variables Same amount of cream Cream applied to same area Conclusion Since both improved their results, it doesn’t appear that the claims for the special cream are true. If cliams were correct, twe should have seen Particks a mont double, but not SpongeBob’s. Improvement were likely due to the workout itself and not the cream
Scientific Models • representation of an object or system that make concepts easier to understand • can represent things to small to see or too large to observe directly • can be used to test hypothesis and illustrate theories
Science Lab Reports A formal lab report should be typed, have page numbers, and contain all of the following information in the following order. Every student is expected to write his or her own report. You are encouraged to discuss the experiment , analysis and interpretation with your classmates but you are expected to turn in original work. If any portion of your report is plagiarized from another student, book or website, you are guilty of academic misconduct. Take pride in your work.
Science Lab Reports • Title Page • title should relate to the basic concept involved in the lab activity • be creative - don’t use your problem statement • graphic relating to lab is required • name, class period and date are required • Problem • states very precisely what you want to know • written as a question • must include independent and dependent variable
Science Lab Reports • Hypothesis • prediction of how your experiment will come out • educated guess based on knowledge & research you have done • prior to experiment • expresses relationships between variables • only valid if testable and supported by evidence • written as an “ If……,then……. because…...” statement • Materials • list, in columns, all equipment and quantities needed for experiment
Science Lab Reports • Procedure • logical, numerical listing of each step needed to conduct experiment • needs to be clear and precise so anyone could repeat experiment without difficulty • should include illustrations with labels to help clarify set-up and/or a particular step • good grammar, spelling & communication skills are important • First step should read: Gather materials • Last step should read: Clean up and complete lab report • Data • Organized presentation of what you have observed • Quantitative Observations - charts/tables with labels and title(s) • Qualitative Observations - paragraph format and/or photos with captions
Science Lab Reports • Data Presentation • Graphs • Independent Variable: placed on horizontal / “x” axis; given info; purposefully changed factor • Dependent Variable: placed on vertical / “y” axis; info obtained during the experiment; response to independent variable • should accommodate at least 75% of paper • title should include the independent & dependent variable and appear in the upper part of the graph • legends (keys) should be within the body of graph and displayed in a box • axes are labeled with variable and units as follows: variable(units) • consistent intervals used in numbering, or an appropriate sign is used to indicate a break • numbers are neatly written and spaced appropriately and logically • everything (text and numbers), but not actually graph, are done in pen
Science Lab Reports • Conclusion Well written, 3 paragraph minimum, which should incorporate any teacher generated questions, summarizing findings • Paragraph 1: Analysis of Hypothesis restate problem and answer it based on experimental findings state whether hypothesis was supported or rejected present quantitative findings that either support or reject hypothesis • Paragraph 2: Limitations and Weakness of your Procedure evaluate the procedure that you used (equipment, materials, methods) describe possible sources of error and modifications for improvement • Paragraph 3: Interpretations of the Data, Conclusion & Ideas for Further Study explain patterns and trends in the data explain results using scientific reasoning & knowledge describe other experiments or extensions of the lab that you feel would be useful to explore the concept further