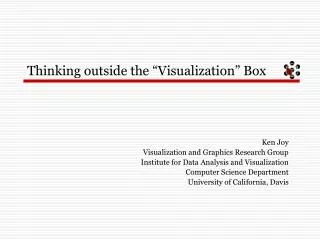
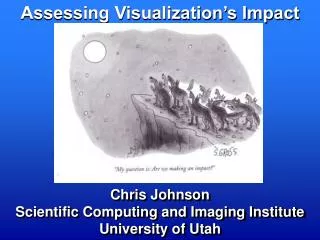
Assessing Visualization’s Impact
Assessing Visualization’s Impact. Chris Johnson Scientific Computing and Imaging Institute University of Utah. Assessing Visualization’s Impact. Visualization (and Related) Reports. Assessing Visualization’s Impact.

Assessing Visualization’s Impact
E N D
Presentation Transcript
Assessing Visualization’s Impact Chris Johnson Scientific Computing and Imaging Institute University of Utah
Assessing Visualization’s Impact • W. Lorensen. On the Death of Visualization. NIH-NSF Visualization Research Challenges Workshop Position Paper, 2004. • Visualization is a critical part of many applications • Visualization is not having an impact in applications • Embrace of customers • Form alliances with other fields • J.J. van Wijk. The Value of Visualization. Proc. IEEE Visualization 2005, p. 79-86, 2005. • A great visualization method is one routinely used by a large number of people to obtain highly valued knowledge while minimizing investments in time and money in hardware, software, effort.
Process of Visualization: Achieving Our Goals Solve Inform Drive Drive Evaluate Design Refine Transitional / Techniques Applied / Problems(Driving Tasks & Data) Basic / Principles Disproportionate percentage of current research is transitional technique refinement Balanced visualization portfolio should also be driven by applied problems and grounded in basic research
Measuring Impact - Easy to Measure • Number and impact of scientific papers • Number of citations of papers, software, etc. • Number of software tools created and distributed • Number of users of visualization software tools, etc. • Number and quality of industrial partnerships, companies created • Number of downloads of software, data, papers • Number of visualization scientists trained
Measuring Impact - Difficult to Measure • Productivity of scientific collaborations • Insight gained and discoveries made by scientists using visualization techniques and tools • Effectiveness of new visualization techniques compared with established techniques • Return on investment versus new technique, software, hardware, and time/effort
Increasing Impact - To Do Items To be most effective, visualization research must do a better job at examining and evaluating the effects of visualization techniques and approaches Quantify and compare visualization algorithm performance increases Create a web page of visualization success stories Catalog and make widely available visualization software, data, models, techniques
Measuring Impact - Issues/Discussion • Low risk, incremental versus high risk, high impact? • User usage/impact, versus basic research, versus technique/tool creation and refinement, what is the right balance? • Should we try to estimate the return on investment versus new technique, software, hardware, and time/effort (a cost model)? Assertion: Largest impact is from infrastructure that is mostly invisible, i.e. it is so completely incorporated into how people do their work, that they presumed its existence because they could no longer imagine working without it. How can we overcome this perception? What should be the time frame for measuring impact? If the goal is long-term impact, there are inherent dangers in short-term measures. • Visualization is a combination of science, technology, and art. How can we better assess impact in fields outside our own? Caveat: Be careful what you measure, that is exactly what you will get!
Assessing Visualization’s Impact • www.sci.utah.edu • crj@sci.utah.edu Application Scientisttist