Download
1 / 25
250 likes | 378 Vues
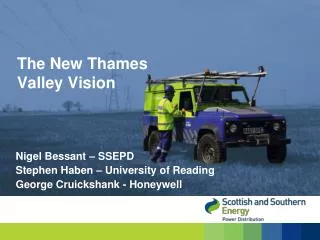
Nigel Bessant – SSEPD Stephen Haben – University of Reading George Cruickshank - Honeywell. The New Thames Valley Vision. Project Metrics. 2011 Tier 2 LCNF Project - £29.9m over five years Focusing on the LV Network Bracknell and the surrounding Thames Valley area. What is the outcome?.

E N D
Nigel Bessant – SSEPD Stephen Haben – University of Reading George Cruickshank - Honeywell The New ThamesValley Vision
Project Metrics • 2011 Tier 2 LCNF Project - £29.9m over five years • Focusing on the LV Network • Bracknell and the surrounding Thames Valley area
What is the outcome? “How will the DNO need to understand, anticipate and support changes in customer behaviour to develop an efficient network for the low-carbon economy?”
Focused on Learning Industry Ready EngagedStakeholders
Stephen Haben University of Reading NTVV – Understanding energy usage behaviour
Overview Forecasts Aggregation Categorisation Smart Control
Data • 250 End point monitors • Customer information for Bracknell area • Up to 325 LV substation monitors • First data estimated to arrive Dec 2012 • First choice of monitors • Heterogeneity, size, assets • Research has begun! • EDRP data (~4500 half hourly smart meter data) • Irish smart meter data1 (>4000 residential) • 1See: http://www.cer.ie/
5 Categorisation 10 9 • Learning to date • Versatile Segmentation • Identification of important/irrelevant variables • Variability of customers and aggregate smoothing • Yearly/dynamic behaviour • Ultra’s – Robust behaviour 8 7 6 4 3 2 1
Applying research to future work • Investigate new segmentations • Improved buddying • New forecasting methods • SMEs • Smart control: real time control, multiple storage devices. New methods for new data!
George Cruickshank Honeywell UK Business Development Manger Smart Grid Solutions Automated Demand Response Honeywell ADR - Fast, Clean & Green
Automated Demand Response (ADR)Overview • Participant recruitment for ADR trial • Selection Process for suitable ADR Buildings • Evolution of contractual arrangements Honeywell ADR - Fast, Clean & Green
Participant Recruitment – Engagement Process SSEPD Data Base & Honeywell Customer Base = ~70% of Potential Sites Thames Valley Chambers of Commerce Bracknell Forest Council National Conferences & Seminars Facility Management Groups Existing Participants National & Local Press Institutes Journals Experience indicates Cold Calling & Mail Shots are least effective Honeywell ADR - Fast, Clean & Green
Participant Enrolment – YTD Progress Tier 2 TARGET 30 Sites + ADR Events April 2013 May June October July August September Honeywell ADR - Fast, Clean & Green
Participant Recruitment Process - Phases Phase 1 – Engagement Identify Site details • Engage local Management • Agree outline • Obtain sign off Phase 2 – Evaluation (2 way) Evaluate ‘Best Fit 3’ criteria • Analyse Data & control strategy etc. Design tailored ADR Strategy Provide Report, Review, Sign Off Base Load Analysis Honeywell ADR - Fast, Clean & Green
Building Suitability - Best Fit Criteria Building Occupancy = Owner or Prime Tennant Building Utilisation = Public, Commercial or Industrial Building Operating Load = > 300kW/h Building BMS = > 99% compatibility Building HVAC = Chillers, AHU’s, P/p’s & Inverters Building Lighting Control = > 90% compatibility Building Fabric = Maintains internal Temperature Key to success = No impact on Safety & No/Low impact on Occupants or IT Honeywell ADR - Fast, Clean & Green
Results of an ADR Event for 1 Building 400 Average 10 Day Load Profile Actual Load Shed >100kW 300 200 Actual Day’s Load Profile kW 100 Base Load HVAC = Occupancy Date:11-9-12 Time:4:30p.m. Duration:1.5 hrs Honeywell ADR - Fast, Clean & Green
Suitable Buildings – Early Selection FactorsPublic Sector, Commercial & Industrial Visual Indicators • Footprint • Design statement • Fabric condition • Glazed construction • Roof profile • Flue stacks • Acoustic Louvers • Parking facilities • Landscaping Data Collation • Energy Bills • Energy Certification • ½ Hour Electrical Data • Capacity agreement • BMS Schedule • Asset Register Honeywell ADR - Fast, Clean & Green
Evolution of Contractual Agreements Heads of Terms - T&C’s developed & enable call off works + scalability Combined Participant Agreement - Honeywell & SSE T&C’s incorporated into one Agreement ADR Load Shedding Strategy - Site Report identifies Peak Load Shedding Strategy + Participant sign off Base Load Analysis - Separate site Report, showing potential savings + ROI & Pay Back term Honeywell ADR - Fast, Clean & Green
Automated Demand Response (ADR): Summary • A real alternative solution to traditional reinforcement • DNOs gain customer engagement Honeywell ADR - Fast, Clean & Green
The New ThamesValley Vision www.thamesvalleyvision.co.uk