Download
1 / 23
230 likes | 399 Vues
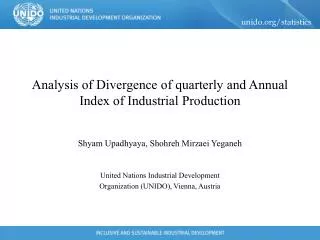
Analysis of Divergence of quarterly and Annual Index of Industrial Production. Shyam Upadhyaya , Shohreh Mirzaei Yeganeh United Nations Industrial Development Organization (UNIDO), Vienna, Austria. The Index of industrial production.

E N D
Analysis of Divergence of quarterly and Annual Index of Industrial Production Shyam Upadhyaya, Shohreh MirzaeiYeganeh United Nations Industrial Development Organization (UNIDO), Vienna, Austria
The Index of industrial production One of the important Short-term economic indicators in official statistics which measures the changes in value added over a given period. Computation of the IIP The laspeyres volume index for period t Where: pi0: Prices for Industry sector i at the base period 0, qi0: Quantity for industry sector i at the base period 0, qit: Quantity for industry sector i at period t, wi0: Relative weight of industry sector i in the base period 0, and i: Number of industry sectors
Reasons for divergence • Difference in coverage and sample • Difference in definition and variables output replaces the value added • Accounting period Calendar year versus accounting year effect • Estimation method, non-response treatment, imputation, etc.
What is benchmarking? • Statistical techniques which are aimed to ensure coherence between time series data of the same target variable measured at different frequencies, e.g., sub-annual and annual • Underlying assumption: low frequency data tends to be more comprehensive and accurate than high frequency data • High frequency data (indicators) are aligned to low frequency data (Benchmark) • Inconsistency is detected by the movement of ratio between Benchmark value (B) and Indicator value (I)
Benchmarking methods -Benchmarking techniques can be categorized into two approaches: • Numerical approach: Pro Rata Distribution, Proportional Denton Method • Statistical modeling approach: ARIMA-model based methods, GLS model, etc. -Another aspect of benchmarking: Extrapolation Linking of quarterly source data onto previous annual estimates, or Constructing forward series by adjusting the last available benchmark level
Pro Rata distribution Splits the annual total based on the proportions indicated by the four (or twelve) quarterly (monthly) observations In mathematical phrase Where VAQt: estimated quarterly value added for quarter Q of year t; IQt: indicator value in quarter Q of year t; and AVAt: the annual value added for year t Extrapolation:
Estimation of monthly value added using Pro Rata distribution (India)
IIP and the Derived Benchmarked Monthly VA using Pro Rata Distribution (India)
IIP and the Derived Benchmarked Quarterly VA using Pro Rata Distribution (China)
Advantages • Easy to compute and interpret • No special software is needed • Sub-annual estimates can be derived each year independently Disadvantages • Smoothens sub-annual estimates only within a year • Concentrates bias in one quarter (month) and causes the abrupt change • As a result, it creates so called “step problem”, therefore it is not recommended for longer time series
The Proportional Denton Method Allows to find VA estimates by minimizing it’s difference with indicator values subject to the constraints provided by the annual benchmarks. Under the restriction that Where VAt: derived value added estimate for quarter/ month t; It: value of the indicator for quarter/ month t; AVA: annual value added T: last quarter/ month for which quarterly/ monthly source data is available
Discussion • Unlike Pro Rata distribution BI ratio in this method changes gradually so there is no jump from one year to another • Computation for estimation of quarterly/ monthly VA is more complicated, thus requiring specialized software such as GAMS and CPLEX • The quarterly/ monthly estimated derive by solving a so-called quadratic programming problem (QP)
Estimation of monthly value added using Proportional Denton Method (India)
IIP and the Derived Benchmarked Monthly VA using Denton Method (India)
Discussion and Recommendations • While seasonally adjusting the Pro Rata benchmarked series, the significant changes in the first quarters (or first months) are often recognized as outliers by seasonal adjustment software • the significance of the step problem depends on the size of the variations in the annual BI ratio • The proportional Denton is most widely used benchmarking method • Denton method provides estimates which are closer to preliminary index series than pro rating distribution on preserves the short-term movements of the IIP time series
Running the QP problem for the whole series each time a new benchmark is available • The sub-annual data should be benchmarked to the annual MVA as soon as it becomes available. The benchmark time series must be revised based on the revision policy • Improving the estimates for the forward series and reducing future revisions of benchmarked sub-annual data by improving the extrapolation techniques
e.g., The enhanced version of proportional Denton method introduced by IMF’s QNA manual • UNIDO encourages developing countries to perform the benchmarking exercise at country level • Benchmarking the source data in earlier steps before compiling the aggregations in highly recommended