Download

1 / 56
560 likes | 688 Vues
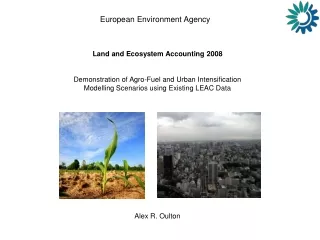
European Environment Agency. Land and Ecosystem Accounting 2008 Demonstration of Agro-Fuel and Urban Intensification Modelling Scenarios using Existing LEAC Data Alex R. Oulton. Part One – Developing Scenarios to Model Potential Agrofuel Developments in Europe.

E N D
European Environment Agency Land and Ecosystem Accounting 2008 Demonstration of Agro-Fuel and Urban Intensification Modelling Scenarios using Existing LEAC Data Alex R. Oulton
Part One – Developing Scenarios to Model Potential Agrofuel Developments in Europe
We can use Corilis data to visualise the relative intensity of pastures and mosaic farmland in Europe using ArcMap
The same can be done visualise the relative intensity of Intensive Agriculture (and any other CLC class)
We can model changes in Intensive Agriculture using Map Algebra From…
Assumptions of the Method: • Intensification of agriculture would be linear across all regions above a selected threshold value (17) • Regions lower than the threshold value would not be subjected to the intensification process
We can use Map Algebra to visualise the total amount of farmland in Europe (Intensive Agriculture + Pastures and Mosaics)
From this data we can visualise the amount of land required if we were to produce different quantities of agro-fuels in Europe 5% of all Agricultural land converted to biofuel plantations
10% of all Agricultural land converted to biofuel plantations
20% of all Agricultural land converted to biofuel plantations
Assumptions of the Method: • Areas with intensity values of 60% - 80% would be most likely for conversion (highlighted in blue) • The method considers the lower threshold of 60% as the most appropriate for conversion, increasing to land with higher intensification values when the demand increases
Map Algebra can also be used to standardise and visualise the relative polarity of land to CLC types using Existing Data…
Assumptions of the Method: • Identifying polarity is a good method for selecting suitable sites within the Intensive Agriculture and the Pasture and Mosaic farming domain • Sites with little or no polarity are of no value when considering likely Agrofuel developments for reasons of land unsuitability
Using the hypothesis that Agro-fuel development would most likely occur in areas not already intensely farmed, but which are suitable according to land cover type, potential agrofuel developments can be identified from both Pastures and Mosaics, and Intensive Agriculture
Assumptions of the Method: • The 50/50 rule is used • There are other hypothesis to explore – set aside land, changes in CAP etc • Both intensive agriculture and pastures and mosaics are considered with equal merit at this stage of analysis
…can be used as a security mechanism to remove any potential Agrofuel developments in unsuitable locations
This leaves a selection of likely Agrofuel developments in Vector Point Format which adhere to selection criteria
Assumptions of the Method: • Using the weighted overlay technique: • DLT - Only Broad Pattern and Intense Agriculture (B1 – score 9) and Rural Mosaic and Pasture Landscape (B2 – score 8) are given consideration as areas in which Agrofuel development could occur • Relief - Only Inlands (score 9) and Uplands (score 4) were given consideration • Only potential conversion zones in areas which had a combination of both scoring factors were saved from elimination
Transport - The “select by location” feature can identify all potential Agrofuel developments within 50km of major and minor roads in the European Highway System
Likely Agrofuel sites can also be classified by their proximity to road networks
Assumptions of the Method: • Distance is important for factoring in unit cost estimation • Also for quantifying the negative environmental impacts of the fuel source
Natura2000 - The “select by location” feature can select potential Agrofuel developments which are more than 1km away from Natura2000 sites
Alternatively Natura2000 sites can be classified according to the total area of potential Agrofuel developments contained within them
Assumptions of the Method: • Two ways of considering the problem of nature protection were executed to account for potentially different policies regarding ecosystem accounting, supply and demand of fuel etc
Arc Map can be used to generate statistics about the number of potential Agrofuel Areas at NUTS2/3 level
Arc Map can be used to generate statistics about the density of potential Agrofuel Areas at NUTS2/3 level
Part Two – Modelling Urban Intensification Scenarios and the Potential Effects on Green Background Landscape Index
Part Two – Modelling Urban Intensification Scenarios and the Potential Effects on Green Background Landscape Index
We can use map algebra to simulate urban intensification using a constant value… CLC1 + 3
It is interesting to note that modelled increases in urban temperatures follow the road network quite closely CLC1 CLC1 + 5 CLC1 + 3 CLC1 + 10
Assumptions of the Method: • Urban intensification is only relevant in areas with a considerable level of urban land cover, therefore a cut off threshold value of (19%) was applied to the intensification process, with areas below that showing no increase • Once again it was important to consider 100% as the maximum attainable intensification level, therefore class boundaries were defined so that values boosted to above 100% were visually confined to the 100% maximum
It is likely that urban intensification will affect the Green Background Landscape Index (GBLI)…
The change will be relatively small due to the composition of GBLI, to visualise this change the index has been reclassified into 5 colour categories
Assumptions of the Method: • The method accounted for the fact that there would be only small changes to the GBLI value in areas within and surrounding intense urban landscapes • The next stage would be to calculate the change in GBLI within UMZ’s to account for the urban intensification
Using Arctoolbox “Extract by Mask” function we can model change in GBLI inside Urban Morphological Zones (UMZ) Current GBLI
Assumptions of the Method: • Urban intensification is only relevant in areas with a considerable level of urban land cover, therefore a cut off threshold value (19) was applied to the intensification process, with areas below that showing no increase • Once again it was important to consider 100% as the maximum attainable intensification level, therefore class boundaries were defined so that the upper class boundaries were visually confined to the 100% maximum
Through merging spatial databases the total amount of Green Urban Area (GUA) can be represented for each UMZ, and normalised by population data to create a simple indicator relating to quality of life in urban areas