Download
1 / 12
120 likes | 153 Vues
Learn how a TN wastewater plant tackled white water influent contamination, tracked the source, conducted tests, and took corrective measures. Discover strategies for handling similar situations effectively.

E N D
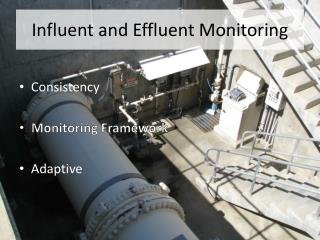
Influent Contamination A small wastewater plant in TN experienced this situation. What would you do if facing a similar situation?
How they reacted. • Divert Flow to EQ Basin • Check • DO, ~1.0 mg/L • pH, 7.2 su • OUR, increased • Track color back up the Collection System
Breathe Easier • All quick tests showed no reason for concern. • Oxygen Uptake Rate • Unfed • Fed • Post White flow • No indication of Toxicity
OUR/SOUR Testing • In this case OUR tests were conducted. • A BOD bottle with 150 ml of RAS and 150 ml of deionized water was read for 10 min. There was a modest usage of O2 recorded over 10 min.. • A second bottle was tested using 150ml or RAS and 150 ml of the “white water” In this bottle the O2 usage rate was high. The O2 in the bottle was used up in three minutes. This indicated that the material was food for the bugs and not toxic. • SOUR would be the test of choice if the test was to be compared to tests on other days where MLSS would have been different.
Locate the source. • White color tracked into the downtown area. • EQ basin began to accumulate some fat chunks. • County High School had been instructed to increase the size of their grease trap. • Perhaps there was a connection.
High School Lift Station • White Water was present in the station • Could this be a grease trap solvent? • There is a lot of grease here also.
School Grounds Inspection • Outside walk around, after 4:00 pm • No evidence of grease trap construction or solvent use. • Kitchen drain area was clean. • Could they be stripping and waxing floors? • Small area at back door looked like someone had washed a paint brush, could it be White Paint?
The evidence was clear! • Painting equipment • Walls taped • No one present • Questions? • Where did they do cleanup? • How much went down the drain?
Longer Term Results • BOD • Composit Sample 58 mg/L • White water 142 mg/L • 245% increase in BOD strength! • TSS 133mg/L • Ammonia 1.7 mg/L
Final Actions • Most all was diverted to the aerated EQ Basin to be bled back into the system. • Color gone from basin within 5 days. • Where does paint go?