Download
1 / 49
490 likes | 611 Vues
“Food prices: Is there a long term problem in feeding the world?”. Christopher L. Gilbert University of Trento, Italy cgilbert@economia.unitn.it. IDEC Crisis Workshop, 26-27 June 2009, Trento, Italy. The recent background.

E N D
“Food prices: Is there a long term problem in feeding the world?” Christopher L. Gilbert University of Trento, Italy cgilbert@economia.unitn.it IDEC Crisis Workshop, 26-27 June 2009, Trento, Italy
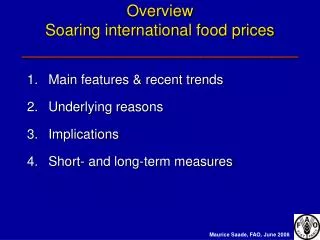
The recent background Major grain and oil seed prices rose sharply in 2007 through to mid-2008. Palm oil led, followed by wheat; maize (corn) lagged. Sugar remained flat. Prices fell back, although not to their original levels, in the second half of 2008, rice less so than other grains. Prices have staged a recovery in 2009, although not on a dramatic scale.
The wider story Movements in agricultural prices were less dramatic than those in either metals or energy, both of which also rose earlier than ags. Agricultural raw materials (natural rubber excepted) did not participate in the boom. These developments have provoked concerns that food prices may be higher over the longer term. IMF commodity price indices Many poor and middle income countries remain net importers of grains. High food prices impacts negatively on many poor households, in particular in the cities.
Food prices and the crisis • The sharp rise in food prices in 2007-08 came at the end of the long boom and as the financial crisis had already started. • High food prices were the principal way in which the crisis impinged on the developing world in 2007-08. • A number of commentators have suggested that high commodity prices resulted from excess speculation and were a bubble phenomenon. A June 2009 U.S. Senate report has accused speculation of driving up wheat prices in 2008. Phillips and Wu (2009) have claimed to have identified a sequence of bubbles rolling across asset markets, starting with NASDAQ (1999-2000), through U.S. real estate (subprime bubble) through to oil in 2008. Ags may not have been immune. • Differently from this, other commentators have suggested that food prices may now be high over the medium to long term.
Structure of this talk • The evidence from history. • Agricultural investment • Biofuels demand • Futures markets • Dollar depreciation • What explains the 2006-08 food price spike? • Why are prices rising again? • Conclusions
The historical view • Prebisch and Singer famously argued that the terms of trade of primary producers relative to manufactures declines over the long term. • If world food supply is becoming more difficult, we should expect a rising food price trend, • The historical record is more complicated. • The choice of deflator is important - export unit values and developed country CPIs have significant services content which rises over time. • I deflate by the US PPI so that the price is then measured relative to other wholesale products.
Wheat 1842-2008 The recent rice is prices is quite small by historical standards The price trend was upward until 1900 but since then has been downward US$ prices deflated by US PPI:
Maize, 1860-2008 As in wheat, the recent rice is prices is quite small by historical standards The price trend was upward until WW2 but since then has been downward US$ prices deflated by US PPI:
IMF Agricultural Foods Index, 1957-2008 The 2006-08 spike is very modest relative to that of 1973-74 The price trend was flat or slightly positive until 1973 but since then has been downward. It is now flat again Deflated by US PPI, 2000 = 100
What the record shows • Food price trends have been variable over the past 150 years – periods of rising prices (late C19), flat prices and falling prices (past three decades). Overall, the trend has been down relative to producer prices in general. • Prices have fallen in the context of major increases in production and consumption. There is no evidence of demand growth leading to higher prices over the long term. So either … • agricultural supply is infinitely elastic in the long run, or • productivity growth has offset any tendency to declining returns.
Will the future be like the past? We cannot be sure. • Are there reasons to believe the contrary? • Two factors may be relevant here: • Lack of investment in agriculture over recent decades. • High energy prices (likely to continue for many years) may result in food crops being diverted into use as biofuel feedstocks.
Agriculture and development • Most poor countries remain predominantly agricultural – in Sub-Saharan Africa (SSA, not South Africa) 34% of GDP and 64% of employment is agricultural. • Poverty is concentrated in rural areas - in 2002, three out of four poor people in developing countries lived in rural areas. • Substantial reduction of poverty, as foreseen in the Millennium Development Goals, requires a rural and agricultural focus. • Agriculture contributed one third of the growth in SSA between 1993-2005. • The World Bank estimates that 81% of the worldwide reduction in rural poverty over 1993-2002 was due to improved conditions in rural areas (19% to migration). • Agriculture can therefore deliver poverty reduction and growth.
Developing countries have been under-investing in agriculture Agricultural investment has been neglected, in ag-based developing countries. This trend is also evident in East Asia Thanks to Luc Christiaensen, UNU-WIDER
Yield improvement is possible Actual and potential (on-farm demonstration) maize yields in Africa. Thanks to Luc Christiaensen, UNU-WIDER
Developing countries and the recession(Ravallion, 2009) • Growth in developing countries will slow as the result of the recession but the poorest countries will generally be least affected. • Growth over the past 15 years has moved large numbers of people put of $2/day poverty – but often only just out. These people remain vulnerable. • Slower growth will slow the (net) move out of poverty. Some households will move back into poverty. • Impacts will be heterogeneous and will depend on circumstances. Households dependent on remittances will be worse off. Mining (deep and artisanal) will generate less. But some crops (cocoa, coffee, sugar) will generate greater revenues than in recent years.
Urban-rural terms of trade • In developing countries, a rise in food prices shifts the terms of trade in favour of rural producers and against urban consumers. • In many countries, this change would correct a long-standing urban policy bias and to that extent should be welcomed. • In 2008, higher world prices were not fully transmitted to developing countries because of high freight rates. Costs rose because of high fertilizer prices. Changes in the terms of trade were therefore small.
Investment Summary • In developing countries, the necessary investment can be forthcoming but it cannot be left entirely to the market. Government action will be necessary to develop infrastructure and in extension. • Land is available for agriculture in developed economies, e.g. by the elimination of set aside. Again, governments need to provide the policy framework. • Larger areas of unexploited or low yield land ia available in middle income countries such as Russia, Ukraine and Kazakhstan.
Demand and supply • Movements in prices in 2006-08 were common to a large number of agricultural commodities. • Ag economists generally see demand as stable with price rises resulting from supply shocks. Although there were some supply problems in 2006 and 2007, harvests were generally good in 2008. • Stock levels for many major ags had become low, but this was not new in 2007 and 2008. Low stocks can explain why a shock has a large impact (positive or negative) but cannot explain the origin of the shock. • Because standard explanations of price change are unavailable, economists have tended to seize on biofuel demand to explain the 2006-08 price changes.
Biofuels (Mitchell, 2008) • Biofuels demand was responsible for the largest part of the rise in food prices but resists the temptation to quantify this share. Abbot et al (2008) concurred with this view. • Maize is the main feedstock crop in the US, oilseeds hold that position in Europe, Brazil uses sugar cane. Thailand uses cassava while palm oil has been most important elsewhere in south Asia. • The global use of maize for feed rose by 1.5% over the four years 2004-07 while its use as a biofuel feedstock grew by 65% over the same period. 70% of the increase in maize production over this period has gone into biofuels. • The expansion in maize production was largely at the expense of soybeans – the 23% increase in the US area devoted to maize in 2007 was associated with a 16% decline in soybean area. • The eight largest wheat exporting countries expanded the area devoted to rapeseed and sunflower by 36% over the period 2001-07 while wheat area in the same countries fell by 1%. • Mitchell concludes that biofuels demand drove food prices over 2006-08
D S p1 p0 Q Oil and biofuels: Schmidhuber (2006) Schmidhuber (2006) argues that the prices of crude oil and fertilizers define a break-even price for maize and palm oil at which of biodiesel yields zero profit and similarly for sugar and ethanol. if the food demand curve for maize intersects with the supply curve at a higher price than this threshold p1, it is uneconomic to use maize as a biofuel feedstock. The maize price is independent of the oil price, If the intersection is beneath the threshold, at po, maize is used in biofuels production. The long run demand curve becomes horizontal at the threshold pulling the maize price is pulled up to this level. A higher oil price raises the maize price threshold and maize prices should move in step with oil prices. Maize becomes a petro-commodity.
What do we know? • The World Bank analysis (Mitchell, 2008) has been very influential. It has result in enormous pressure being imposed on U.S. and European governments to cut back on energy-security driven mandates on biofuel production. The E.U. has reduced the mandate from 10% to 2%. • Mitchell does not produce any direct evidence for the claim that biofuel demand drove up food prices. Instead, the argument is that there is no other explanation (a residual argument). Is it the case that no other explanation is available? • Schmidhuber’s analysis leads us to expect that there should be a close link between oil price changes and food prices over recent years. This provides an indirect check on Mitchell. • I will argue that Mitchell’s case is overstated and that there is as yet little evidence that should lead us to restrict biofuels production.
Price formation • There are active futures markets for many of the most important agricultural commodities – wheat, maize, soybeans, where prices rose sharply over 2006-08, and also cocoa, coffee, cotton and sugar, where there was no boom. • Active trading allows markets to efficiently incorporate information about supply and demand fundamentals. If non-fundamentally based trading takes place, futures markets can act as a distorting lens. • If prices become too high won’t Warren Buffett sell? If there are too few experts relative to the amateurs, and if the experts have short time horizons (for example, because of quarterly reporting), they will tend to follow the amateurs hoping to get out in time (De Long et al, 1991). • Many commentators (Desai, Masters, Phillips, Soros) have suggested that commodity futures prices were a type of bubble over 2006-08.
Index investment in futures markets • This is a relatively new phenomenon. • Investors have identified commodities as an “asset class” . They see portfolio diversification advantages in adding a proportion of commodity futures to equity and bond portfolios – Gorton and Rouwenhorst (2006). • These position differ from traditional speculative positions in several respects: • They are almost invariably long. • They are typically rolled forward and turn over slowly. • They track specific indices (e.g. DJ-GSCI) rather than taking positions on specific markets. • They can be large in relation to the overall market.
Since 2006, the CFTC has published figures on the offsetting futures positions taken by index providers. These can account for up to 40% of all outstanding positions on these markets. Elena Corazzella and I have constructed an index of these positions, IF, which we use in the subsequent analysis.
Exchange rates and prices • Most ag prices are denominated in terms of the U.S. dollar. • A decline in the value of the U.S. will rise these prices. • A simple argument (Ridler and Yandle, 1972) shows that the elasticity must be less than unity – if not, a uniform depreciation of the dollar against all countries would raise prices in all currencies, not just the dollar, upsetting market balance. • This result extends to the elasticity for a general set of exchange rate changes provided the exchange rate index is appropriately weighted. The weights reflect production and consumption shares and elasticities. • In the case that elasticities are equal across countries, the elasticity is one minus the U.S. dollar share or production and/or consumption. • Exchange rate effects on prices are small but consistent over time. Accurate estimation requires a long sample.
Exchange rates and ag prices move broadly together This correlation (0.96) is even higher than that with futures index positions (0.81). The two explan-ations compete with each other
What explains food price rises? There are three candidates • Dollar deprecation: if the dollar is worth less, dollar food prices will be higher. Unrestricted estimation gives an exchange rate elasticity in excess of unity. I impose an elasticity of 0.53 estimated over data from 1971-2008. • The high oil price: oil and related products (in particular fertilizers) are inputs into food production. Biofuels demand will increase consumption. • Futures market activity: we have seen bubble-type activity in other markets, so ag markets may not be immune.
Cointegration • I have 39 monthly observations from 2006/1 to 2009/3. This forces a parsimonious analysis. • Is there an equilibrium relationship between these three variables and the IMF’s agricultural food price index in the Engle-Granger sense that the food price index reverts back to the level implied for equilibrium. • I investigate this question in two ways: • I use OLS to estimate the long run equation, as the initial stage of the Engle-Granger two stage procedure. • I use the Johansen procedure to test for the cointegrating rank in a VAR(2) model linking the levels of the four variables. • In both cases, I establish the presence of a single cointegrating relationship. However, the unrestricted Engle-Granger procedure gives an exchange rate elasticity in excess of unity. Imposition of a unit elasticity is acceptable.
The oil price elasticity is almost exactly equal to the 17% pass-through estimated by Baffes (2007). The estimated impact is less than the 15%-20% estimated by Mitchell (2008). This impact can be accounted for in terms of upward shift in the supply curve without recourse to a shift in demand. • All three estimates imply some inflation of food prices from futures market activity.
Getting behind the numbers • The preceding analysis identified dollar depreciation, the rising oil price and futures activity as the proximate causes of the 2006-08 price rises. Where does this leave biofuels demand? • To the extent that food prices were driven by exchange rate changes, there is no room for a biofuels explanation. • There are three possible channels: • The higher the oil price, the more attractive becomes biofuels production. Anticipating this, the market bids up the prices of grains and oil seeds in relation to rises in the price of oil. The low estimated oil price elasticity makes this unlikely. • Index futures positions may be speculations on future biofuels demand. This seems implausible • Biofuels may be in the residual (unexplained) component of the food price change (but how can we know?) • I suspect that biofuels demand is indeed an “intriguing” and perhaps “significant story relating to particular markets” (Cooper and Lawrence, 1975) and not a major explanation for recent food price changes.
2009 • Food prices are rising again in 2009 from post-Lehman lows. Why? • Two factors are important: • Fertilizer prices are only now falling. • Restocking. • Rice played an important element in this process.
The rice story Rice is the principal food of many poor people. An increase in the rice price has a negative impact on poverty levels worldwide. Bangkok rice export price. Source: World Bank The cause of the 2007 rise in the rice price was the Indian government’s misguided decision to prohibit rice exports. (India is a major rice exporter). The government’s objective was to protect its population from the effects of the rising wheat price – but at the expense of the poor in rice-importing countries.
Trade or stocks? • Developing countries, in which food is the major item of household expenditure, are necessarily concerned with food security. • Two strategies are available: • Food security stockpiles – financially costly since resources are tied up in stocks, administratively costly and prone to corruption. • Trade: less costly and efficient if shocks are uncorrelated across countries. • Development agencies, particularly the World Bank, have pushed for trade-based food security. This did not work in 2008, particularly in rice (Haiti, Philippines). • Governments have learnt that they cannot rely on trade – and hence are rebuilding depleted inventories. This is pushing up world food prices.
Fertilizers Prices moved up sharply in late 2007, lagging food prices. Phosphates and urea turned down in mid-2008, too late for the southern hemisphere spring. Most fertilizer prices are now reasonable for current northern hemisphere crops. Potash remains suspiciously high.
The outlook • Provided harvests are reasonable, I expect food prices to come down over the coming year – fertilizer prices are falling and restocking should be over. • However, the dollar remains fairly low and may go lower, pushing dollar prices up. • Low oil prices has resulted in biofuels production has being very unprofitable in Europe and the U.S.A. over the past nine months. In the U.S., it has been sustained by the biofuels mandate. Prospects look better with oil at $70/bl but maize prices remain above the Schmidhuber threshold. • My view is that $70 is near the maximum OPEC can hope to sustain without encouraging production of non-conventional oil. But if oil does get back towards $100, this may pull food prices further up.
Conclusions (1) • The world can feed itself – but only with the necessary investment. • Developing countries can increase yields relatively easily – we do not need a second “green revolution”. • The role of biofuels demand in driving up food prices has been exaggerated. It is premature to take action to limit biofuels production. • Dollar deprecation and futures index investment were more important factors in driving up food prices. They are highly correlated and it is difficult to disentangle them.
Conclusions (2) • Attention should be given to the operation of commodity futures markets and their effects on prices. It would be extreme to prohibit certain types of actors or investments but greater transparency is desirable. • Agricultural prices are still high because of high fertilizer prices and reversion to stock-based food security. Governments should push for a new WTO protocol limiting the ability of countries to impose food export bans or taxes. • My expectation is that food prices will fall over the coming year.