
Xfast
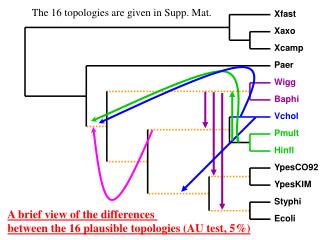
The 16 topologies are given in Supp. Mat. Xfast. Xaxo. Xcamp. Paer. Wigg. Baphi. Vchol. Pmult. Hinfl. YpesCO92. YpesKIM. Styphi. A brief view of the differences between the 16 plausible topologies (AU test, 5%). Ecoli.

Xfast
E N D
Presentation Transcript
The 16 topologies are given in Supp. Mat. Xfast Xaxo Xcamp Paer Wigg Baphi Vchol Pmult Hinfl YpesCO92 YpesKIM Styphi A brief view of the differences between the 16 plausible topologies (AU test, 5%) Ecoli
Principal component analysis for the markers using the16 plausible topologies 1 0.8 0.6 0.4 0.2 TRUE 0 fake -0.8 -0.6 -0.4 -0.2 0 0.2 0.4 0.6 0.8 1 1.2 random -0.2 -0.4 -0.6 -0.8 -1 20%
An unrooted tree with 13 taxa has 23 branches. Each of these branches can alternatively be thought of as a split of the 13 taxa into the two groups of taxa, each group being on one side or the other of that branch. The collection of splits defines the tree. Since terminal branches are present in all trees, the splits corresponding to these can be ignored. Thus a total of 10 non-terminal splits, compatible with a tree, are required to define it. When apply heat maps to bootstrap support for splits calculated by PhyML, 4 categories, G law, JTT model of evolution, there were 321 splits of taxa that received positive bootstrap support for at least one of the 205 genes (instead of 364). Among these only 14 had bootstrap support larger than 5% for a majority of genes. The bootstrap support for these 14 splits is given with two-way clustering in supp.mat A. One can see that there are 8 splits that have large bootstrap support for the vast majority of genes. These splits are compatible and suggest that a large number of trees are in agreement with some patterns of vertical descent. However, a total of 10 non-terminal compatible splits are required to define a tree.Thus while many of the genes are congruent with some portion of the tree, there is considerable disagreement about where some subtrees should be placed. Clusters of genes support differing groups of some of the additional splits 9-14 that received bootstrap support 5% for a majority of genes. While a majority of the genes support the first 8 splits, the second heat map of this supp. Mat, which considers 20 of the genes on the left side of Figures 5A shows that a substantial number of genes do not uniformly support these splits either.
Further study of the dispersal of gammaproetobacterial genes on the PCA 2.5 2 1.5 1 0.5 0 -2 -1.5 -1 -0.5 0 0.5 1 -0.5 Genes with LBA random -1 LBA artefact Extreme artefact of tree reconstruction (Terminal Branch Length multiplied by 10,20,30 and inner branch lengths divided by 5,10,20) or LBA would produce compatible dispersals
Further details of the dispersal of gammaproetobacterial genes on the PCA with details of the simulated data with long/short branches LBA+ group ok 2.5 LBA+ wrong group LBA ++ group ok LBA++ wrong group LBA+++ group ok 2 LBA+++ wrong group LBA group ok LBA group wrong LBA= group ok 1.5 LBA= wrong group true genes short branches 1 0.5 0 -2 -1.5 -1 -0.5 0 0.5 1 -0.5 -1 Different strong artefact of tree reconstruction: LBA/+/=/++/+++: Terminal Branch Length multiplied by 5/10/15/20/30. Short branches: inner branch lengths divided by 5/10 and 20. Group OK: long branches are sister-group on the tree. Wrong group: long branches are distantly related on the tree
Deeper look in the “artefact” In red: LBA for unrelated taxa, in blue LBA between related taxa: the dispersal is the same
Details of the dispersal of simulated LBA gammaproetobacterial genes only 2.5 2 1.5 short branches 1 LBA 1 LBA + LBA++ 0.5 LBA+++ LBA15 0 -2 -1.5 -1 -0.5 0 0.5 1 -0.5 -1 The dispersal of true genes on axis 1 is compatible with different artefact (i.e. fast evolution between unrelated group, as well as a “radiation” (low signal or hard polytomy at the base of the group)
Heterogeneity of evolutionary rates 2.5 2 1.5 1 0.5 201 193 185 177 169 161 153 145 137 129 121 113 97 105 89 81 73 0 65 57 49 41 33 25 9 17 1 Average estimated rate of evolution by species 1 0.9 0.8 0.7 0.6 1:YpesKIM___: 0.5 0:Baphi_____: 1:Ecoli_____: 0.4 1:Hinfl_____: 0.3 0:Paer______: 0.2 1:Pmult_____: 0.1 1:Styphi____: 0 1:Vchol_____: 0:Xaxo______: 0:Xcamp_____: 0:Xfast_____: 1:YpesCO92__:
1:YpesKIM___: 0:Baphi_____: 1:Ecoli_____: 1:Hinfl_____: 196 0:Paer______: 183 1:Pmult_____: 170 1:Styphi____: 157 1:Vchol_____: 0:Xaxo______: 144 0:Xcamp_____: 131 0:Xfast_____: 118 1:YpesCO92__: 105 92 79 66 53 40 27 14 1 Heterogeneity of evolutionary rates Genes Taxa There is no systematic bias. No species seems to be evolving really fast and the combination of “fast evolving species” differs between the genes