Download
1 / 24
250 likes | 396 Vues
In today's class, we will focus on the refraction reduction and analysis techniques using SeisImager. This software allows for modern interpretations of our field lab data through three distinct methods, correcting for elevation and non-planar layers. We will explore inverse modeling, the time-term method, and the tomographic method, discussing their strengths and assumptions. We will also cover essential field procedures, including equipment testing, permissions, and survey planning for accurate data collection. Completion of homework by Tuesday is required.

E N D
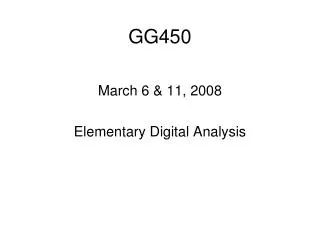
GG450 April 10, 2008 Refraction Procedures Interpretation
SeisImager loaded on machines in 733: We'll spend most of our class today in 733 to get you started on the refraction reduction and analysis. HOMEWORK due Tuesday - see last lecture
We will use a modern program for the analysis of our field lab data – one that offers three different methods of interpretation of the data, and which applies corrections for elevation of the ground, and for non-planar layers. The models obtained by inversion of the data are as good as the data entered and the as the decisions made before processing. Noisy data = noisy results. The following is from the SeisImager Manual.
The methods of analysis of refraction data are INVERSE modeling techniques - they use the data you give the program to find the best-fitting models possible within the constraints of the software. Again, while these models can be very good, they are only MODELS, and they are not necessarily correct. This becomes obvious when you compare the results of the time term method with those of the tomographic method. Both methods, as presented in the software are 2-D. They allow variations in depth and distance along the profile.
Appendix B - The Time-term Method • The time-term technique is a linear Least-Squares approach to determining the best descrete-layer solution to the data. The math behind this technique is comparatively simple. Referring to the figure below from the SeisImager manual:
The SLOWNESS, or ray parameter, si=1/vi, is used to obtain the travel time of a ray where layer boundaries are horizontal: • We get t from the travel times and distance (x) from the data and we want to solve for z and S2. • The above example assumes that the refractor is parallel to the ground surface. If we expand this to the general case – non-parallel, curved surfaces, as shown below – we end up with three unknowns rather than two, e.g. z1, z2and S2.
This geometry gives us: t=cz1+cz2+xS2 , and we can form the linear set of equations:
The time-term method then solves the eigenvalue equation for s2 and zk, the slowness of the lower layer and the depths to the interface at each geophone. We know all the tj and xj values.
This (time-term) method ASSUMES that the velocities in each layer are CONSTANT, and that the changes in travel time are caused by changes in DEPTH of the interface. While it is not a general model, it works well and yields reasonable solutions. The RECIPROCAL TRAVELTIME inversion method (Appendix C) is more general and makes fewer assumptions, but it requires more data (which we have) and more work from the analyst. Because of the time-consuming work involved, we won’t use this method. The TOMOGRAPHIC METHOD (Appendix D) requires an initial velocity model (such as you might get from the Time Term Method). Rays are traced through a model made up of many cells and the velocities in each cell are changed to improve the fit until acceptably small errors in travel time are achieved.
Tomographic Inversion can give detailed models of excellent resolution if you have lots of data.
When working with the analysis of your data, try the “RayTrace” option in SeisImager. This option calculates the travel times for the resulting model and calculates and plots the errors between the model and the data. Be sure to see the directions for SeisImager on the web page, and the Lab directions for what I expect for your lab report. You will also find the complete SeisImager Manual in the Seisimager folder on the computers.
Refraction Field Procedures • The preparation for yesterday's field work was done for you for efficiency, but you should know what was involved: • Before doing a survey: • • Motivation: • How deep are you looking? What is the expected velocity contrast? What resolution do you need? What will the results be used for?
• Study the local geologic setting • Compile other data – well logs, maps, local use history, etc. • • Test equipment. Many surveys in remote areas fail or cost too much because of faulty or forgotten equipment. Test EARLY - in time to make repairs.
• Plan survey parameters – line lengths, directions, geophone spacing. Know the analysis software, and plan the survey to make it easy to import data. • •Obtain permissions, permits, inform residents and owners • • Make a list of required equipment and spares
Guidelines: • •shoot along and perpendicular to any known strike. • •ALWAYS shoot reversed profiles and orthogonal lines. • •make line lengths (shot point to far geophone) at least 3-4 times target depth. • •stay away from trees, traffic, wind. • •You need clean unambiguous data, make it as clear as possible.
• bury the geophones if possible. Good coupling to the ground is essential to get good data, otherwise the sensor measures its own motion, not the motion of the ground • • use hammer if target depth less than 50-100’ • use explosive source if the target is deeper (requires permits and $)
• check data to be sure target is obtained before leaving site • • check data to be sure surface layer is well defined – shoot with close-spaced geophones if necessary.
Geophone placement •In-line spread: most common, shot points on same line as geophones (this is what we did) •Offset spread: shot points several feet from geophones. Requires some correction at closest phones. •In-line with center shot: same as in-line with extra shot at center of spread (we did this also) •Fan shooting: shots off-line looking for 2-dimensional targets, like salt domes or caverns
CORRECTIONS TO DATA: Our models so far have assumed that the surface of the earth is flat (all shots and geophone elevations the same), and that the layers below are planar. This is not often the case, and corrections often need to be made for elevation and thickness of the low-velocity surface layer. Most models assume that layer velocities are constant – not changing with depth inside the layer, or laterally.
Changes in depth of layers and changes in velocity ARE OFTEN VISIBLE in the data. For example: • What’s happening near point A? Point B? What might explain the dip in the travel times near point A and the increases in travel times near Point B?
The waviness of the travel time curve implies variations from planar layers and/or lateral variations in velocity. The dashed lines show the arrival times from the top figure. Since arrival come in earlier than expected in region “A”, either the velocity of the top layer must be greater than normal OR the depth the top of the lower layer must be shallower than elsewhere. In region “B”, the opposite is the case.
The figure below shows seismograms from a single shot (not our data). The blue highlighting shows the times of arrival of refractions. Light blue shows surface waves. Note that in refraction seismology we are usually interested only in the first arrivals. 0 200 400 Time (ms) 800 1000