
Graphing Linear Inequalities: Understanding Region Boundary
E N D
Presentation Transcript
Graphing Linear Inequalities • A linear inequality describes a region of the coordinate plane that has a boundary line. (This region is called a half-plane.) • Every point in that region is a solution of the inequality.
Solutions • When the inequality symbol has an “or equal to” (>, <, =) symbol, the boundary line is part of the solution. • The boundary line will be a solid line. • Whenthe inequality symbol is just greater or less than (>, <), or not equal (≠), the boundary line is NOT part of the solution. • The boundary line will be a dashed line.
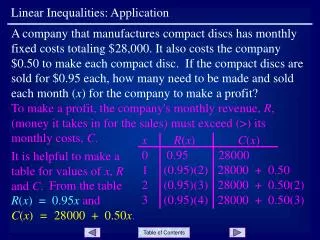
You have a gift card for Itunes worth $20. An album cost $5 and a single song cost $1. What are all the possible combinations of albums and single songs you can buy? How can we graph this ?
Example 1 • Graph: 5a +s ≤20 • Convert to slope intercept form! • Graph the line. • Decide if the line should be solid or dashed. • Decide whether to shade above or below the line by using a test a point below or above the line , usually (0,0)
Example 2 • Graph: y < 3x – 2 • Remember that (0, –2) is the y-intercept. • Remember that 3 (or 3/1) is the slope. • Graph the line. • Decide if the line should be solid or dashed. • This would be dashed. • Decide whether to shade above or below the line by testing a point below or above the line
(0, 0) Example 1 Solution • Graph: y < 3x – 2 • Graph the line --Dashed • Shade --Below the line • Check a point (0, 0) • y < 3x – 2 0 < 3(0) - 2 0 < -2 False—so not in shaded area
(0,b) Example 2: Write an inequality for the graph. • Write the equation of the line in slope-intercept form (y = mx + b). - Find the y-intercept (0, b). • Find the slope (m) using rise over run. • Decide on the inequality symbol. • Since the shading is above the line, use greater than ( >). • Since the line is solid, use the “or equal to” ( > ). • Inequality: y > -2/3x + 4