Download
1 / 1
60 likes | 250 Vues
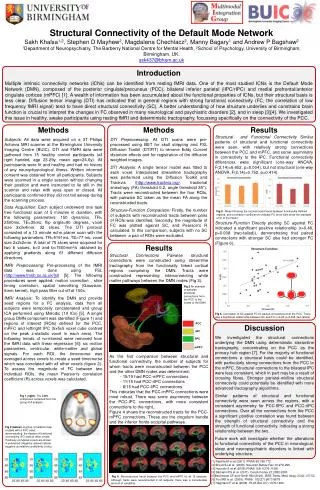
Structural Connectivity of the Default Mode Network Sakh Khalsa 1,2 , Stephen D Mayhew 2 , Magdalena Chechlacz 2 , Manny Bagary 1 and Andrew P Bagshaw 2

E N D
Structural Connectivity of the Default Mode Network Sakh Khalsa1,2, Stephen D Mayhew2, Magdalena Chechlacz2, Manny Bagary1 and Andrew P Bagshaw2 1Department of Neuropsychiatry, The Barberry National Centre for Mental Health, 2School of Psychology, University of Birmingham, Birmingham, UK. ssk437@bham.ac.uk . Introduction Multiple intrinsic connectivity networks (ICNs) can be identified from resting fMRI data. One of the most studied ICNs is the Default Mode Network (DMN), composed of the posterior cingulate/precuneus (PCC), bilateral inferior parietal (lIPC/rIPC) and medial prefrontal/anterior cingulate cortices (mPFC) [1]. A wealth of information has been accumulated about the functional properties of ICNs, but their structural basis is less clear. Diffusion tensor imaging (DTI) has indicated that in general regions with strong functional connectivity (FC, the correlation of low frequency fMRI signal) tend to have direct structural connectivity (SC). A better understanding of how structure underlies and constrains brain function is crucial to interpret the changes in FC observed in many neurological and psychiatric disorders [2], and in sleep [3][4]. We investigated this issue in healthy, awake participants using resting fMRI and deterministic tractography, focussing specifically on the connectivity of the PCC. Methods Subjects: All data were acquired on a 3T Philips Achieva MRI scanner at the Birmingham University Imaging Centre (BUIC). DTI and FMRI data were gathered from 15 healthy control participants (all right handed, age 23-29y, mean age=24.6y). All participants were fit and healthy and had no history of any neurophysiological illness. Written informed consent was obtained from all participants. Subjects were scanned in a single session without changing their position and were instructed to lie still in the scanner and relax with eyes open or closed. All participants confirmed they did not fall asleep during the scanning process. Methods DTI Preprocessing: All DTI scans were pre-processed using BET for skull stripping and FSL Diffusion Toolkit (DTIFIT) to remove Eddy Current distortion effects and for registration of the diffusion weighted images. DTI Analysis: A single tensor model was fitted to each voxel. Interpolated streamline tractography was performed using the Diffusion Toolkit and Trackvis (http://www.trackvis.org/, fractional anisotropy (FA) threshold 0.2, angle threshold 35°). Tracts were reconstructed between the four ROIs, with pairwise SC taken as the mean FA along the reconstructed tracts. Structure-Function Comparison: Firstly, the number of subjects with reconstructed tracts between pairs of ROIs was identified. Secondly, the magnitude of FC was plotted against SC, and Pearson's R calculated. In this comparison, subjects with no SC between a pair of ROIs were excluded. Results Structural and Functional Connectivity Similar patterns of structural and functional connectivity were seen, with relatively strong connections between the PCC and mPFC, and some asymmetry in connectivity to the IPC. Functional connectivity differences were significant (one-way ANOVA, F(2,14)=6.652, p=0.004), but not structural (one-way ANOVA, F(2,14)=0.752, p=0.414). Structure-Function Directly plotting SC against FC indicated a significant positive relationship (r=0.48, p=0.008 (two-tailed)), demonstrating that paired connections with stronger SC also had stronger FC (Figure 6). Fig 5. Mean FA along the reconstructed tracts between functionally defined regions, and correlation coefficient to indicate FC (error bars show the standard error of the mean). Data Acquisition: Each subject underwent one task free functional scan of 5 minutes in duration, with the following parameters: 150 dynamics, TR= 2500ms, TE=35ms; flip angle=80 degrees, voxel size 3x3x4mm; 32 slices. The DTI protocol consisted of a 13 minute echo planer scan with the following parameters; TR=5191ms, TE=77 ms, voxel size 2x2x2mm. A total of 75 slices were acquired for two b values, b=0 and b=1500mm2/s obtained by applying gradients along 61 different diffusion directions. fMRI Preprocessing: Pre-processing of the fMRI data was done using FSL (http://www.fmrib.ox.ac.uk/fsl) [5]. The following procedures were applied: motion correction , slice timing correction, spatial smoothing (Gaussian, 6mm kernel), high pass filter cut off at 100s. fMRI Analysis: To identify the DMN and provide seed regions for a FC analysis, data from all subjects were temporally concatenated and group ICA performed using Melodic (10 ICs) [5]. A single group DMN component was identified (Figure 1) and regions of interest (ROIs) defined for the PCC, mPFC and left/right IPC (5x5x5 voxel cube centred on the peak z-statistic voxel in each area). The following trends of no-interest were removed from the fMRI data with linear regression [6]: six motion parameters, ventricular, white-matter and global signals. For each ROI, the timecourse was averaged across voxels to create a seed timecourse which was correlated with all other voxels (figure 2). To assess the magnitude of FC between two individual ROIs, the mean Pearson's correlation coefficient (R) across voxels was calculated. Results Structural Connections Pairwise structural connections were constructed using streamline tractography from the functionally linked cortical regions comprising the DMN. Tracts were constructed representing interconnecting white matter pathways between the DMN nodes (Fig 3). As the first comparison between structural and functional connectivity, the number of subjects for whom tracts were reconstructed between the PCC and the other DMN nodes was determined: - 15/15 had PCC-mPFC connections - 11/15 had PCC-rIPC connections - 8/15 had PCC-lIPC connections. This indicates that the PCC-mPFC connections were most robust. There was some asymmetry between the PCC-IPC connections, with more consistent connections to the right,. Figure 4 shows the reconstructed tracts for the PCC-mPFC connections. These are the cingulum bundle and the inferior fronto-occipital pathways. Fig.3 An example of pairwise structural connections from the PCC to the nodes of the DMN. Fig 6. Correlation of SC against FC for paired connections from the PCC. There was a significant relationship between SC and FC (r=0.48, p=0.008 (two-tailed)). Discussion We investigated the structural connections underlying the DMN using deterministic streamline tractography, concentrating on the PCC as the primary hub region [7]. For the majority of functional connections a structural basis could be identified, with particularly strong connections from the PCC to the mPFC. Structural connections to the bilateral IPC were less consistent, which in part may be a result of crossing fibres. Stronger parietal-midline structural connectivity could potentially be identified with more advanced tractography algorithms. Similar patterns of structural and functional connectivity were seen across the regions, with a consistent asymmetry for PCC-lIPC and PCC-rIPC connections. Over all the connections from the PCC a significant positive correlation was found between the strength of structural connectivity and the strength of functional connectivity, indicating a strong relationship between the two. Future work will investigate whether the alterations to functional connectivity of the PCC in neurological, sleep and neuropsychiatric disorders is linked with underlying structure. rIPC lIPC PCC mPFC Fig 1 (right). The DMN component extracted from the group ICA analysis. Fig 2 (below). A group correlation map created with a PCC seed, demonstrating the degree of functional connectivity (FC) and all other voxels. Positively correlated voxels are shown in yellow/red. Negative values indicate negative correlation coefficients in blue. [1] Raichle M et al (2001). PNAS 95:765-772. [2] Broyd SJ et al. (2009). Neurosci Behav Rev 33:279-296 [3] Horovitz S et al (2009) PNAS 106:11376-11381. [4] Sämann PG et al. (2011). Cereb Cortex 21:2082-2093 [5]Beckmann CF and Smith SM (2004). IEEE Trans. Med. Imag. 23(2):137-52. [6] Fox MD et al. (2005). PNAS 102(27):9673-9678 [7] Hagmann P et al (2008). PLoS Biol 6(7):1479-1493. Fig 4.Reconstructed tracts between the PCC and mPFC for all 15 subjects. Although tracts were reconstructed in all subjects, there was a considerable amount of variability.