Download

1 / 121
1.22k likes | 1.43k Vues
Principles and Practice of Application Performance Measurement and Analysis on Parallel Systems. Lecture 2: Practical Performance Analysis and Tuning. 2012 | Bernd Mohr Institute for Advanced Simulation (IAS) Jülich Supercomputing Centre (JSC). Fall-back Simple timers

E N D
Principles and Practice of Application PerformanceMeasurement and Analysis on Parallel Systems Lecture 2: Practical Performance Analysis and Tuning 2012 | Bernd Mohr Institute for Advanced Simulation (IAS) Jülich Supercomputing Centre (JSC)
Fall-back • Simple timers • Hardware counter measurements • Overview of some performance tools • Practical Performance Analysis and Tuning • Challenges and open problems in performance optimization • Heterogeneous systems • Automatic performance analysis: KOJAK/Scalasca • Beyond execution time and flops • Extremely large HPC systems • Tool integration
Fall-back: Home-grown Performance Tools • If performance analysis and tuning tools are • not available • too complex and complicated it is still possible to do some simple measurements • Time Measurements • gettimeofday( ) • clock_gettime( ) • ... • Hardware Performance Counter Measurements • PAPI
Timer: gettimeofday() • UNIX function • Returns wall-clock time in seconds and microseconds • Actual resolution is hardware-dependent • Base value is 00:00 UTC, January 1, 1970 • Some implementations also return the timezone #include <sys/time.h> struct timeval tv; double walltime; /* seconds */ gettimeofday(&tv, NULL); walltime = tv.tv_sec + tv.tv_usec * 1.0e-6;
Timer: clock_gettime() #include <time.h> struct timespec tv; double walltime; /* seconds */ Clock_gettime(CLOCK_REALTIME, &tv); walltime = tv.tv_sec + tv.tv_nsec * 1.0e-9; POSIX function For clock_id CLOCK_REALTIMEreturns wall-clock time in seconds and nanoseconds More clocks may be implemented but are not standardized Actual resolution is hardware-dependent
Timer: getrusage() • UNIX function • Provides a variety of different information • Including user time, system time, memory usage, page faults, etc. • Information provided system-dependent! #include <sys/resource.h> struct rusage ru; double usrtime; /* seconds */ int memused; getrusage(RUSAGE_SELF, &ru); usrtime = ru.ru_utime.tv_sec + ru.ru_utime.tv_usec * 1.0e-6;memused = ru.ru_maxrss;
Timer: Others • MPI provides portable MPI wall-clock timer • Not required to be consistent/synchronized across ranks! • Same for OpenMP 2.0 (!) programming • Hybrid MPI/OpenMP programming? • Interactions between both standards (yet) undefined #include <mpi.h> double walltime; /* seconds */ walltime = MPI_Wtime(); #include <omp.h> double walltime; /* seconds */ walltime = omp_get_wtime();
Timer: Others • Fortran 90 intrinsic subroutines • cpu_time() • system_clock() • Hardware Counter Libraries • Vendor APIs (PMAPI, HWPC, libhpm, libpfm, libperf, ...) • PAPI
What Are Performance Counters • Extra logic inserted in the processor to count specific events • Updated at every cycle • Strengths • Non-intrusive • Very accurate • Low overhead • Weaknesses • Provides only hard counts • Specific for each processor • Access is not appropriate for the end usernor well documented • Lack of standard on what is counted
Multi platform interface • Kernel level issues • Handling of overflows • Thread accumulation • Thread migration • State inheritance • Multiplexing • Overhead • Atomicity Kernel • Multi-platform interfaces • The Performance API - PAPI • University of Tennessee, USA • LIKWID • University of Erlangen, Germany Hardware Counters Interface Issues Hardware counters
Hardware Measurement • Typical measured events account for: • Functional units status • Float point operations • Fixed point operations • Load/stores • Access to memory hierarchy • Cache coherence protocol events • Cycles and instructions counts • Speculative execution information • Instructions dispatched • Branches mispredicted
Typical Hardware Counter Cycles / Instructions Floating point instructions Integer instructions Load/stores Cache misses TLB misses Useful derived metrics IPC - instructions per cycle Float point rate Computation intensity Instructions per load/store Load/stores per cache miss Cache hit rate Loads per load miss Loads per TLB miss Hardware Metrics • Derived metrics allow users to correlate the behavior of the application to one or more of the hardware components • One can define threshold values acceptable for metrics and take actions regarding program optimization when values are below/above the threshold
Accuracy Issues • Granularity of the measured code • If not sufficiently large enough, overhead of the counter interfaces may dominate • Pay attention to what is not measured: • Out-of-order processors • Sometimes speculation is included • Lack of standard on what is counted • Microbenchmarks can help determine accuracyof the hardware counters
Hardware Counters Access on Linux • Linux had not defined an out-of-the-box interface to access the hardware counters! • Linux Performance Monitoring Counters Driver (PerfCtr)by Mikael Pettersson from Uppsala X86 + X86-64 • Needs kernel patching! • http://user.it.uu.se/~mikpe/linux/perfctr/ • Perfmon by Stephane Eranian from HP – IA64 • It was being evaluated to be added to Linux • http://www.hpl.hp.com/research/linux/perfmon/ • Linux 2.6.31 • Performance Counter subsystem provides an abstraction of special performance counter hardware registers
Utilities to Count Hardware Events • There are utilities that start a program and at the end of the execution provide overall event counts • hpmcount (IBM) • CrayPat (Cray) • pfmon from HP (part of Perfmon for AI64) • psrun (NCSA) • cputrack, har (Sun) • perfex, ssrun (SGI) • perf (Linux 2.6.31)
Hardware Counters: PAPI • Parallel Tools Consortium(PTools) sponsored project • Performance Application Programming Interface • Two interfaces to the underlying counter hardware: • The high-level interface simply provides the ability to start, stop and read the counters for a specified list of events • The low-level interface manages hardware events in user defined groups called EventSets • Timers and system information • C and Fortran bindings • Experimental PAPI interface to performance counters support in the linux 2.6.31 kernel • http://icl.cs.utk.edu/papi/
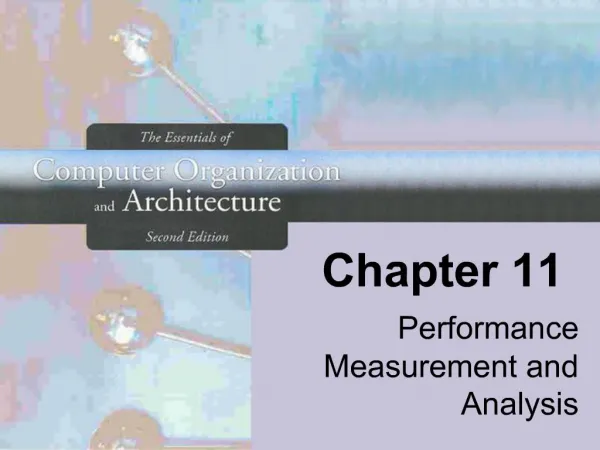
PAPI Low Level Portable Layer PAPI MachineDependentSubstrate PAPI Architecture Tools PAPI High Level Machine Specific Layer Kernel Extensions Operating System Hardware Performance Counters
PAPI Predefined Events • Common set of events deemed relevant and usefulfor application performance tuning (wish list) • papiStdEventDefs.h • Accesses to the memory hierarchy, cache coherence protocol events, cycle and instruction counts, functional unit and pipeline status • Run PAPI papi_avail utility to determine which predefined events are available on a given platform • Semantics may differ on different platforms! • PAPI also provides access to native events on all supported platforms through the low-level interface • Run PAPI papi_native_avail utility to determine which predefined events are available on a given platform
PAPI avail Utility % papi_avail -h This is the PAPI avail program. It provides availability and detail information for PAPI preset and native events. Usage: papi_avail [options] [event name] papi_avail TESTS_QUIET Options: -a display only available PAPI preset events -d display PAPI preset event info in detailed format -e EVENTNAME display full detail for named preset or native event -h print this help message -t display PAPI preset event info in tabular format (default)
PAPI Preset Listing (derose@jaguar1) 184% papi_avail LibLustre: NAL NID: 0005dc02 (2) Lustre: OBD class driver Build Version: 1, info@clusterfs.com Test case avail.c: Available events and hardware information. ------------------------------------------------------------------------- Vendor string and code : AuthenticAMD (2) Model string and code : AMD K8 (13) CPU Revision : 1.000000 CPU Megahertz : 2400.000000 CPU's in this Node : 1 Nodes in this System : 1 Total CPU's : 1 Number Hardware Counters : 4 Max Multiplex Counters : 32 ------------------------------------------------------------------------- Name Code Avail Deriv Description (Note) PAPI_L1_DCM 0x80000000 Yes Yes Level 1 data cache misses () PAPI_L1_ICM 0x80000001 Yes Yes Level 1 instruction cache misses () PAPI_L2_DCM 0x80000002 Yes No Level 2 data cache misses () PAPI_L2_ICM 0x80000003 Yes No Level 2 instruction cache misses () PAPI_L3_DCM 0x80000004 No No Level 3 data cache misses () PAPI_L3_ICM 0x80000005 No No Level 3 instruction cache misses () PAPI_L1_TCM 0x80000006 Yes Yes Level 1 cache misses () PAPI_L2_TCM 0x80000007 Yes Yes Level 2 cache misses () PAPI_L3_TCM 0x80000008 No No Level 3 cache misses () . . .
Example: papi_avail –e PAPI_L1_TCM (AMD Opteron) Event name: PAPI_L1_TCM Event Code: 0x80000006 Number of Native Events: 4 Short Description: |L1 cache misses| Long Description: |Level 1 cache misses| Developer's Notes: || Derived Type: |DERIVED_ADD| Postfix Processing String: || |Native Code[0]: 0x40001e1c DC_SYS_REFILL_MOES| |Number of Register Values: 2| |Register[0]: 0x20f P3 Ctr Mask| |Register[1]: 0x1e43 P3 Ctr Code| |Native Event Description: |Refill from system. Cache bits: Modified Owner Exclusive Shared| |Native Code[1]: 0x40000037 IC_SYS_REFILL| |Number of Register Values: 2| |Register[0]: 0xf P3 Ctr Mask| |Register[1]: 0x83 P3 Ctr Code| |Native Event Description: |Refill from system| |Native Code[2]: 0x40000036 IC_L2_REFILL| |Number of Register Values: 2| |Register[0]: 0xf P3 Ctr Mask| |Register[1]: 0x82 P3 Ctr Code| |Native Event Description: |Refill from L2| |Native Code[3]: 0x40001e1b DC_L2_REFILL_MOES| |Number of Register Values: 2| |Register[0]: 0x20f P3 Ctr Mask| |Register[1]: 0x1e42 P3 Ctr Code| |Native Event Description: |Refill from L2. Cache bits: Modified Owner Exclusive Shared|
PAPI papi_native_avail Utility (AMD Opteron) (derose@sleet) 187% papi_native_avail |more Test case NATIVE_AVAIL: Available native events and hardware information. ------------------------------------------------------------------------- Vendor string and code : AuthenticAMD (2) Model string and code : AMD K8 Revision C (15) CPU Revision : 10.000000 CPU Megahertz : 2193.406982 CPU's in this Node : 2 Nodes in this System : 1 Total CPU's : 2 Number Hardware Counters : 4 Max Multiplex Counters : 32 ------------------------------------------------------------------------- The following correspond to fields in the PAPI_event_info_t structure. Symbol Event Code Count |Short Description| |Long Description| |Derived| |PostFix| The count field indicates whether it is a) available (count >= 1) and b) derived (count > 1) FP_ADD_PIPE 0x40000000 |Dispatched FPU ops - Revision B and later revisions - Speculative add pipe ops excluding junk ops| |Register Value[0]: 0xf P3 Ctr Mask| |Register Value[1]: 0x100 P3 Ctr Code| FP_MULT_PIPE 0x40000001 |Dispatched FPU ops - Revision B and later revisions - Speculative multiply pipe ops excluding junk ops| |Register Value[0]: 0xf P3 Ctr Mask| |Register Value[1]: 0x200 P3 Ctr Code| . . .
High Level API • Meant for application programmers wantingsimple but accurate measurements • Calls the lower level API • Allows only PAPI preset events • Eight functions: • PAPI_num_counters • PAPI_start_counters, PAPI_stop_counters • PAPI_read_counters • PAPI_accum_counters • PAPI_flops • PAPI_flips, PAPI_ipc (New in Version 3.x) • Not thread-safe (Version 2.x)
Example: Quick and Easy Mflop/s program papiMflops parameter (N=1024) include "f77papi.h" integer*8 fpins real*4 realtm, cputime, mflops integer ierr real*4 a(N,N) call random_number(a) call PAPIF_flops(realtm, cputime, fpins, mflops, ierr) do j=1,N do i=1,N a(i,j)=a(i,j)*a(i,j) end do end do call PAPIF_flops(realtm, cputime, fpins, mflops, ierr) print *,' realtime: ', realtm, ' cputime: ', cputime print *,' papi_flops: ', mflops, ' Mflop/s' end % ./papiMflops realtime: 3.640159 cputime: 3.630502 papi_flops: 29.67809 MFlops
General Events program papicount parameter (N=1024) include "f77papi.h" integer*8 values(2) integer events(2), ierr real*4 a(N,N) call random_number(a) events(1) = PAPI_L1_DCM events(2) = PAPI_L1_DCA call PAPIF_start_counters(events, 2, ierr) do j=1,N do i=1,N a(i,j)=a(i,j)*a(i,j) end do end do call PAPIF_read_counters(values, 2, ierr) print *,' L1 data misses : ', values(1) print *,' L1 data accesses: ', values(2) end % ./papicount L1 data misses : 13140168 L1 data accesses: 500877001
Low Level API • Increased efficiency and functionalityover the high level PAPI interface • 54 functions • Access to native events • Obtain information aboutthe executable, the hardware, and memory • Set options for multiplexingand overflow handling • System V style sampling (profil()) • Thread safe
Fall-back • Simple timers • Hardware counter measurements • Overview of some performance tools • Practical Performance Analysis and Tuning • Challenges and open problems in performance optimization • Heterogeneous systems • Automatic performance analysis: KOJAK/Scalasca • Beyond execution time and flops • Extremely large HPC systems • Tool integration
PerfSuite (NCSA) • Multi-platform sampling-based HW counter and code profiler • http://perfsuite.ncsa.illinois.edu/ • Works on un-modified, optimized executables • Usage • Run withmpiexec –x -np #psrun <exe> • Specify HW counter set with–c <spec>.xml • Combine single process output withpsprocess –o out.xml –c <exe>*.xml • psprocess out.xml
Example HW Counter Spec File <?xml version="1.0" encoding="UTF-8" ?> <ps_hwpc_eventlist class="PAPI"> <!-- =========================================== Configuration file for JUROPA system. =========================================== --> <ps_hwpc_event type="preset" name="PAPI_FP_INS" /> <ps_hwpc_event type="preset" name="PAPI_L2_TCA" /> <ps_hwpc_event type="preset" name="PAPI_L2_TCM" /> <ps_hwpc_event type="preset" name="PAPI_TOT_CYC" /> <ps_hwpc_event type="preset" name="PAPI_TOT_INS" /> <ps_hwpc_event type="preset" name="PAPI_VEC_SP" /> <ps_hwpc_event type="preset" name="PAPI_VEC_DP" /> </ps_hwpc_eventlist> • Check possible HW counter combinations with • papi_avail –a • papi_event_chooser PRESET <ctr1> <ctr2> …
Example Single Process Output PerfSuite Hardware Performance Summary Report {{ Execution Information . . . }} {{ Processor and System Information . . . }} {{ Cache Information . . . }} Index Description Counter Value ============================================================================================ 1 Floating point instructions...................................... 3077100612 2 Level 2 total cache accesses..................................... 243374393 3 Level 2 cache misses............................................. 238543113 4 Total cycles..................................................... 15720301793 5 Instructions completed........................................... 6581331748 6 Single precision vector/SIMD instructions........................ 8651424 7 Double precision vector/SIMD instructions........................ 8651424 Event Index ============================================================================================ 1: PAPI_FP_INS 2: PAPI_L2_TCA 3: PAPI_L2_TCM 4: PAPI_TOT_CYC 5: PAPI_TOT_INS 6: PAPI_VEC_SP 7: PAPI_VEC_DP Statistics ============================================================================================ Counting domain........................................................ user Multiplexed............................................................ no Graduated floating point instructions per cycle........................ 0.196 Floating point instructions per graduated instruction.................. 0.468 Graduated instructions per cycle....................................... 0.419 % floating point instructions of all graduated instructions............ 46.755 Bandwidth used to level 2 cache (MB/s)................................. 2848.381 MFLIPS (cycles)........................................................ 574.107 MFLIPS (wall clock).................................................... 552.968 MIPS (cycles).......................................................... 1227.906 MIPS (wall clock)...................................................... 1182.693 CPU time (seconds)..................................................... 5.360 Wall clock time (seconds).............................................. 5.565 % CPU utilization...................................................... 96.318
Example Combined Process Output PerfSuite Hardware Performance Summary Report Execution Information ============================================================================================ Date : Tue Aug 16 12:56:13 CEST 2011 Hosts : jj01c38 jj01c40 Users : zdv176 Minimum and Maximum Min Max ============================================================================================ % CPU utilization..................................... 96.22 [jj01c40] 97.10 [jj01c40] % floating point instructions of all graduated instructions 37.12 [jj01c38] 50.07 [jj01c38] Bandwidth used to level 2 cache (MB/s)................ 2719.16 [jj01c38] 3035.46 [jj01c40] CPU time (seconds).................................... 5.34 [jj01c40] 5.39 [jj01c40] Floating point instructions per graduated instruction. 0.37 [jj01c38] 0.50 [jj01c38] Graduated floating point instructions per cycle....... 0.19 [jj01c38] 0.20 [jj01c40] Graduated instructions per cycle...................... 0.39 [jj01c38] 0.51 [jj01c38] MFLIPS (cycles)....................................... 558.48 [jj01c38] 576.54 [jj01c40] MFLIPS (wall clock)................................... 540.69 [jj01c38] 555.30 [jj01c40] MIPS (cycles)......................................... 1142.80 [jj01c38] 1504.55 [jj01c38] MIPS (wall clock)..................................... 1105.62 [jj01c38] 1456.64 [jj01c38] Wall clock time (seconds)............................. 5.55 [jj01c40] 5.56 [jj01c38] Aggregate Statistics Median Mean StdDev Sum ============================================================================================ % CPU utilization....................................... 96.82 96.83 0.27 1549.21 % floating point instructions of all graduated instructions 43.50 44.01 3.75 704.22 Bandwidth used to level 2 cache (MB/s).................. 2895.58 2892.44 113.83 46279.08 CPU time (seconds)...................................... 5.39 5.38 0.01 86.07 Floating point instructions per graduated instruction... 0.43 0.44 0.04 7.04 Graduated floating point instructions per cycle......... 0.19 0.19 0.00 3.10 Graduated instructions per cycle........................ 0.45 0.44 0.04 7.10 MFLIPS (cycles)......................................... 570.90 568.83 4.62 9101.24 MFLIPS (wall clock)..................................... 552.88 550.77 4.26 8812.25 MIPS (cycles)........................................... 1312.64 1300.75 105.35 20812.03 MIPS (wall clock)....................................... 1266.86 1259.42 101.48 20150.65 Wall clock time (seconds)............................... 5.56 5.56 0.01 88.90
(Rice University) Intelcompiler • Multi-platform sampling-based callpath profiler • http://hpctoolkit.org • Works on un-modified, optimized executables • Usage • Compile with -g [-debug inline-debug-info] • hpcstruct<exe> • Run withmpiexec –x -np # $HPCTOOLKIT_ROOT/bin/hpcrun<exe> • mpiexec –x -np # $HPCTOOLKIT_ROOT/bin/hpcprof-mpi -S <exe>.hpcstruct -I path-to-src hpctoolkit-<exe>-measurements-<some-id> • hpcviewer hpctoolkit-<exe>-database-<some-id>
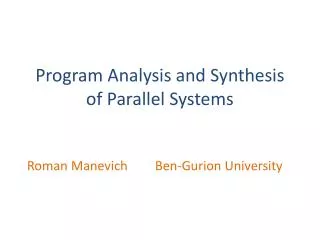
Example hpcviewer associated source code Callpath to hotspot
MPI Profiling: mpiP • Scalable, light-weight MPI profiling library • Generates detailed text summary of MPI behavior • Time spent at each MPI function callsite • Bytes sent by each MPI function callsite (where applicable) • MPI I/O statistics • Configurable traceback depth for function callsites • Usage • Compile with –g • Link with -L$MPIP_LIBRTS -lmpiP -lbfd -liberty -lm -lz • http://mpip.sourceforge.net/
mpiP Text Output Example @ mpiP @ Version: 3.1.1 // 10 lines of mpiP and experiment configuration options // 8192 lines of task assignment to BlueGene topology information @--- MPI Time (seconds) ------------------------------------------- Task AppTime MPITime MPI% 0 37.7 25.2 66.89 // ... 8191 37.6 26 69.21 * 3.09e+05 2.04e+05 65.88 @--- Callsites: 26 ------------------------------------------------ ID Lev File/Address Line Parent_Funct MPI_Call 1 0 coarsen.c 542 hypre_StructCoarsen Waitall // 25 similiar lines @--- Aggregate Time (top twenty, descending, milliseconds) -------- Call Site Time App% MPI% COV Waitall 21 1.03e+08 33.27 50.49 0.11 Waitall 1 2.88e+07 9.34 14.17 0.26 // 18 similiar lines
mpiP Text Output Example (cont.) @--- Aggregate Sent Message Size (top twenty, descending, bytes) -- Call Site Count Total Avrg Sent% Isend 11 845594460 7.71e+11 912 59.92 Allreduce 10 49152 3.93e+05 8 0.00 // 6 similiar lines @--- Callsite Time statistics (all, milliseconds): 212992 --------- Name Site Rank Count Max Mean Min App% MPI% Waitall 21 0 111096 275 0.1 0.000707 29.61 44.27 // ... Waitall 21 8191 65799 882 0.24 0.000707 41.98 60.66 Waitall 21 * 577806664 882 0.178 0.000703 33.27 50.49 // 213,042 similiar lines @--- Callsite Message Sent statistics (all, sent bytes) ----------- Name Site Rank Count Max Mean Min Sum Isend 11 0 72917 2.621e+05 851.1 8 6.206e+07 //... Isend 11 8191 46651 2.621e+05 1029 8 4.801e+07 Isend 11 * 845594460 2.621e+05 911.5 8 7.708e+11 // 65,550 similiar lines
MPI Profiling: FPMPI-2 • Scalable, light-weight MPI profiling library with special features • 1st special: Distinguishes between messages of different sizes within 32 message bins (essentially powers of two) • 2nd special: Optionally identifies synchronizationtime • On synchronizing collective calls • Separateswaiting time from collective operation time • On blocking sends • Determines the time until the matching receive is posted • On blocking receives • Determines time the receive waits until the message arrives • All implemented with MPI calls • Pro: Completely portable • Con: Adds overhead (e.g., MPI_Send MPI_Issend/Test) • http://www.mcs.anl.gov/fpmpi/
FMPI2 Output Example MPI Routine Statistics (FPMPI2 Version 2.1e) Processes: 8192 Execute time: 52.77 Timing Stats: [seconds] [min/max] [min rank/max rank] wall-clock: 52.77 sec 52.770000 / 52.770000 0 / 0 user: 52.79 sec 52.794567 / 54.434833 672 / 0 sys: 0 sec 0.000000 / 0.000000 0 / 0 Average of sums over all processes Routine Calls Time Msg Length %Time by message length 0.........1........1.... K M MPI_Allgather : 1 0.000242 4 0*00000000000000000000000 MPI_Allgatherv: 1 0.00239 28 0000*00000000000000000000 MPI_Allreduce : 12 0.000252 96 00*0000000000000000000000 MPI_Reduce : 2 0.105 8 0*00000000000000000000000 MPI_Isend : 233568 1.84 2.45e+08 01.....1112111...00000000 MPI_Irecv : 233568 0.313 2.45e+08 02...111112......00000000 MPI_Waitall : 89684 23.7 MPI_Barrier : 1 0.000252
FMPI2 Output Example (cont.) Details for each MPI routine % by message length (max over 0.........1........1…... processes [rank]) K M MPI_Isend: Calls : 233568 436014 [3600] 02...111122......0000000 Time : 1.84 2.65 [3600] 01.....1112111...0000000 Data Sent : 2.45e+08 411628760 [3600] By bin : 1-4 [13153,116118] [ 0.0295, 0.234] : 5-8 [2590,28914] [ 0.00689, 0.0664] // ... : 131073-262144 [8,20] [ 0.0162, 0.0357] Partners : 245 max 599(at 2312) min 47(at 1023) MPI_Waitall: Calls : 89684 Time : 23.7 SyncTime : 6.07 // Similar details for other MPI routines
“Swiss Army Knife” ofPerformance Analysis : TAU • Very portable tool set for instrumentation, measurementand analysis of parallel multi-threaded applications • Instrumentation API supports choice • between profiling and tracing • of metrics (i.e., time, HW Counter (PAPI)) • Uses Program Database Toolkit (PDT) forC, C++, Fortran source code instrumentation • Supports • Languages: C, C++, Fortran 77/90, HPF, HPC++, Java, Python • Threads: pthreads, Tulip, SMARTS, Java, Win32, OpenMP • Systems: same as KOJAK + Windows + MacOS + … • http://tau.uoregon.edu/ • http://www.cs.uoregon.edu/research/pdt/
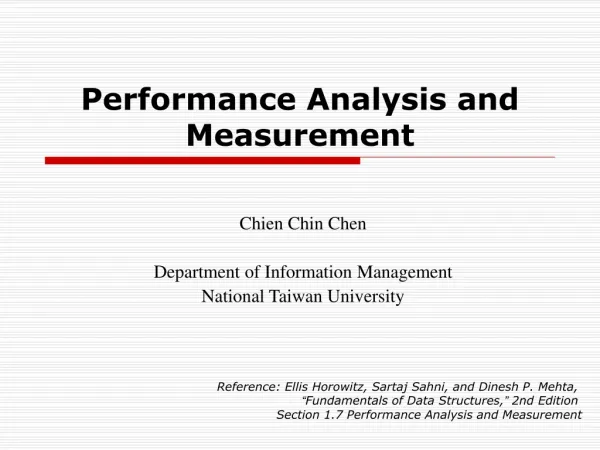
Performance Monitoring TAU Performance System Components Performance Data Mining TAU Architecture Program Analysis PDT PerfExplorer Parallel Profile Analysis PerfDMF ParaProf TAUoverSupermon
TAU Instrumentation • Flexible instrumentation mechanisms at multiple levels • Source code • manual • automatic • C, C++, F77/90/95 (Program Database Toolkit (PDT)) • OpenMP (directive rewriting with Opari) • Object code • pre-instrumented libraries (e.g., MPI using PMPI) • statically-linked and dynamically-loaded (e.g., Python) • Executable code • dynamic instrumentation (pre-execution) (DynInst, MAQAO) • virtual machine instrumentation (e.g., Java using JVMPI) • Support for performance mapping • Support for object-oriented and generic programming
ParaProf –Callgraph View (MFIX) Box width and color indicate different metrics
TAU Usage • Usage: • Specify programming model by setting TAU_MAKEFILEto one of $<TAU_ROOT>/<arch>/lib/Makefile.tau-*Examples from Linux cluster with Intel compiler and PAPI: • MPI: Makefile.tau-icpc-papi-mpi-pdt • OMP: Makefile.tau-icpc-papi-pdt-openmp-opari • OMPI: Makefile.tau-icpc-papi-mpi-pdt-openmp-opari • Compile and link with • tau_cc.sh file.c ... • tau_cxx.sh file.cxx... • tau_f90.sh file.f90 ... • Execute with real input dataEnvironment variables control measurement mode • TAU_PROFILE, TAU_TRACE, TAU_CALLPATH, … • Examine results with paraprof
Vampirtrace MPI Tracing Tool • Library for Tracing of MPI and Application Events • Records MPI-1 point-to-point and collective communication • Records MPI–2 I/O operations and RMA operations • Records user subroutines • Uses the standard MPI profiling interface • Usage: • Compile and link with • vtcc -vt:cc mpicc file.c ... • vtcxx -vt:cxx mpiCC file.cxx... • vtf90 -vt:f90 mpif90 file.f90 ... • Execute with real input data ( generates <exe>.otf)
Vampirtrace MPI Tracing Tool • Versions up to 4.0 until 2003 were commerciallydistributed by PALLAS as VampirTrace • Current status • Commercially distributed by Intel • Version 5 and up distributed as Intel Trace Collector • For Intel based platforms only • http://software.intel.com/en-us/articles/intel-cluster-toolkit/ • New open-source VampirTrace version 5 distributed byTechnical University Dresden • Based on KOJAK’s measurement systemwith OTF backend • http://www.tu-dresden.de/zih/vampirtrace/ • Is also distributed as part of Open MPI
Vampir Event Trace Visualizer • Originally developed byForschungszentrumJülich • Now all development byTechnical UniversityDresden Visualization and Analysis of MPIPrograms Commercialproduct
Vampir Event Trace Visualizer • Versions up to 4.0 until 2003 were commerciallydistributed by PALLAS as Vampir • Current status • Commercially distributed by Intel • Version 4 distributed as Intel Trace Analyzer • For Intel based platforms only • Intel meanwhile released own new version (ITA V6 and up) • http://software.intel.com/en-us/articles/intel-cluster-toolkit/ • Original Vampir (and new VNG) commercially distributed byTechnical University Dresden • http://www.vampir.eu