
PERT/CPM
E N D
Presentation Transcript
Key Terms • Critical Path: The longest time path through the task network. The series of tasks (or even a single task) that dictates the calculated finish date of the project (That is, when the last task in the critical path is completed, the project is completed) The "longest" path (in terms of time) to the completion of a project. If shortened, it would shorten the time it takes to complete the project. Activities off the critical path would not affect completion time even if they were done more quickly.
Slack Time The amount of time a task can be delayed before the project finish date is delayed. Total slack can be positive or negative. If total slack is a positive it indicates the amount of time that the task can be delayed without delaying the project finish date. If negative, it indicates the amount of time that must be saved so that the project finish date is not delayed. Total Slack = Latest Start - Earliest Start. By default and by definition, a task with 0 slack is considered a critical task. If a critical task is delayed, the project finish date is also delayed. (Also known as float time)
Crashing Shifting resources to reduce slack time so the critical path is as short as possible. Always raises project costs and is typically disruptive – a project should be crashed with caution.
Gantt Chart: A bar chart. While visually appealing on a task/duration basis, it is limited because it does not show task or resource relationships well. Strength: easy to maintain and read. • Network Diagram: A wire diagram, Also known as a PERT network diagram. A diagram that shows tasks and their relationships. Limited because it shows only task relationships. Strength: easy to read task relationships.
Dependencies Links between project tasks. There are 3 types of dependencies: • Causal, where 1 task must be completed before another can begin (have to bake bread before you can make a sandwich) • critical path schedules are based only on causal dependencies • Resource, where a task is limited by availability of resources (more bread can be baked by 2 bakers, but only 1 is available) • Discretionary, optional task sequence preferences that, though not required, may reflect organizational preferences
Dummy activity An imaginary activity with no duration, used to show either an indirect relationship between 2 tasks or to clarify the identities of the tasks . In CPM, each activity must be uniquely defined by its beginning and ending point. When two activities begin and end at the same time, a dummy activity (an activity which begins and ends at the same time) is inserted into the model to distinguish the two activities.
Milestone Asignificant task which represents a key accomplishment within the project. Typically requires special attention and control.
Work Breakdown Structure (WBS) • A detailed, hierarchical (from general to specific) tree structure of deliverables and tasks that need to be performed to complete a project. • Purpose: to identify actual tasks to be done in a project. Serves as basis for project planning. • An extension to PERT.
Work Breakdown Structure • Identify the major task categories • Identify sub-tasks, and sub-sub-tasks • Use verb-noun to imply action to something • Example: Getting up in the morning • Hit snooze button • Hit snooze button again • Get outa bed • Avoid dog • Go to bathroom…
Create WBS • Decomposition of project deliverables and activities into smaller, more manageable parts • The lowest level in WBS is a Work Package based on Statement Of Work (SOW) • Needs to be S.M.A.R.T (Specific, Measurable, Attainable, Realistic, Timely)
Work Breakdown Structure • Requires structured brainstorming
WBS Dictionary • A companion document to the WBS • May have detailed content of the components contained in a WBS, including work packages and control accounts • For each WBS component, the WBS dictionary includes a code of account identifier, a statement of work, responsible organization, and a list of schedule milestones • Can include a list of associated schedule activities, resources required, and an estimate of cost • Each WBS component is cross-referenced, as appropriate, to other WBS components
Project Management Assumptions • PM makes several key assumptions • All tasks have distinct begin and end points • All estimates can be mathematically derived • Tasks must be able to be arranged in a defined sequence that produces a pre-defined result • Resources may be shifted to meet need • Cost and time share a direct relationship (Cost of each activity is evenly spread over time) • Time, of itself, has no value • These assumptions make PM controversial
THE PM Concept AssumptionA Critical Path Exists • A small set of activities, which make up the longest path through the activity network control the entire project. • If these "critical" activities could be identified & assigned to responsible persons, management resources could be optimally used by concentrating on the few activities which determine the fate of the entire project. • Others can be re-planned, rescheduled & resources for them can be reallocated, without affecting the project.
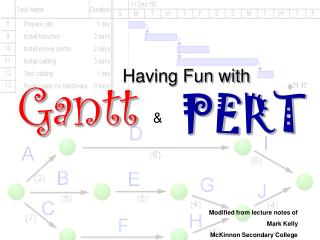
Standardized PM Tools • 1917: Henry Gantt introduced standardized PM tools • Gantt Chart – visual tracking of tasks and resources • Depiction of relationships between tasks • Depiction of constraints between tasks • First Widespread acceptance of a single technique • Created out of need and frustration as industrialization became ever more complex
PERT & CPM • PERT (Program Evaluation and Review Technique) – introduced by US military (Navy) in 1958 • US Navy : control costs & schedules for Polaris Submarine construction • CPM (Critical Path Method) – introduced by US industry in 1958 (DuPont Corporation and Remington-Rand) • Industry: control costs and schedules in manufacturing • Common weakness to both: ignores most dependencies • Considers only completion of a preceding required task • Both rely on a logical sequence of tasks • Organized visually (Charts), tabular or simple lists
Planting trees with flowers and edging around them – tasks required to complete this project: 1.Mark utilities,2.Dig Holes,3.Buy trees,4.Buy flowers,5.Plant trees,6.Plant flowers,7.Buy edging,8.Install edging This list does not reflect time or money This list does not reflect task relationships This list is a simple sequence of logical events This list does not provide an easy project “snapshot” Hard to see conflicts An Example of a Logical SequenceMaking a simple list of tasks
An Example of a Logical SequenceTabular – including time and cost data NOTE: Shaded areas are concurrent tasks that are completed along the timeline- they contribute to overall cost but not overall duration
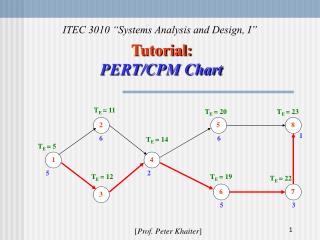
An Example of a Logical SequenceVisual - Using a PERT Chart (Network Diagram) Planting trees with flowers and edging around them Visual – task relationships are clear – good snapshot
Variation in Networks • Standards such as BS 6046 • Activity on Arrow • Activity on Node
Forward and Backward Pass • Forward pass is a technique to move forward through a diagram to calculate activity duration. Backward pass is its opposite. • Early Start (ES) and Early Finish (EF) use the forward pass technique. • Late Start (LS) and Late Finish(LF) use the backward pass technique. • MEMORY TRIGGER: if the float of the activity is zero, the two starts (ES and LS) and the two finish (EF and LF) are the same. Hence, If float of activity is zero, ES = LS and EF = LF.
PM Today – Necessary? • Frustration with cost & schedule overruns • Frustration with reliability of production estimates • Management challenges exist today: • Only 44% of projects are completed on time • On average, projects are 189% over-budget • 70% of completed projects do not perform as expected • 30% of projects are canceled before completion • On average, projects are 222% longer than expected • PM has been shown to improve this performance These statistics were compiled by an independent monitoring group, The Standish Group, and represent the US national average for 1998
PERT/CPM CALCULATIONS Basic Techniques
PERT Calculations • Step 1: Define tasks • Step 2: Place Tasks in a logical order, find the critical path • The longest time path through the task network. The series of tasks (or even a single task) that dictates the calculated finish date • Step 3: Generate estimates • Optimistic, pessimistic, likely and PERT- expected • Standard Deviation and variance • Step 4: Determine earliest and latest dates • Step 5:Determine probability of meeting expected date • Steps 1 and 2 are logic and legwork, not calculation – these require a clear goal
PERT Calculations – Step 3 • Assuming steps 1 and 2 have been completed begin calculations – use a table to organize your calculations • Simple calculations to estimate project durations • Based on input of 3 estimated durations per task • Most Optimistic (TO) – best case scenario • Most Likely (TL) “normal” scenario • Most Pessimistic (TP) Worst case scenario • Formula derives a probability-based expected duration (TE) • (TO x 1 +TL x 4 + TP x 1) / 6 = TE • Read this formula as the sum of (optimistic x 1 + likely x 4 + pessimistic x 1) divided by 6 = expected task duration • Complete this calculation for all tasks
PERT Calculations – Step 3 • Standard deviation and variance • Standard deviation (SD) is the average deviation from the estimated time • SD=(TP-T0)/6 {read as (pessimistic-optimistic)/6} • As a general rule, the higher the standard deviation the greater the amount of uncertainty • Variance (V) reflects the spread of a value over a normal distribution • V=SD2 (Standard deviation squared)
PERT Calculations – Step 3 • When doing manual PERT Calculations it is helpful to construct a table to stay organized • Consider the sample project– planting trees and flowers, set up using a list • Rough estimates and no risk analysis • No Range, simply rough estimates - unreliable? • PERT Analysis will better refine estimates • Start by setting up a table to organize data
Our Project – A Refresher Set up in tabular form, it might look like this… Set up in visual form it might look like this…
PERT Step 3– First Get Organized In considering all tasks on the previous slide, a table might look like this TO-Optimistic TM-Likely TP-Pessimistic TE-Expected (Derived by PERT) Remember – tasks 3, 4 and 7 are concurrent and do not add to the timeline
PERT Step 3– Durations After generating estimates using the formula, the table might look like this TO-Optimistic TM-Likely TP-Pessimistic TE-Expected (Derived by PERT) SD=Standard Deviation V=Variance
PERT Step 4 – Dates For each task, determine the latest allowable time for moving to the next task The difference between latest time and expected time is called slack time Tasks with zero slack time are on the critical path ES=Earliest Start EF= Earliest Finish LS=Latest Start LF=Latest Finish
PERT Step 5 – Probabilities Manually computing probability using data compiled in your table • Determine probability of meeting a date by using the table data • Denote the sum of all expected durations on the critical path as S • Denote the sum of all variances on the critical path as V • Select a desired completion time, denote this as D • COMPUTE: (D-S)/square root (V) = Z ( the number of std. deviations that the due date is away from the expected date)) • Enter a standard normal table to find a probability that corresponds with Z • For our project, figure a probability based on the most likely time, 15 days: (15-15.51)/square root(2.53) = (15-15.51)/1.59=-.3207 (Z) • A corresponding probability is 37.7% (Rounded) • This process can be repeated for any date desired
PERT Step 5 – Probabilities Computing probability in Excel using data compiled in your table • Microsoft Excel has normal distribution functions built in and can compute PERT probabilities • By creating a table as a spreadsheet, the addition of a few simple formulae will do the rest of the work • Create a table as a template that can be used over and over again – simply change the input