Download
1 / 38
380 likes | 527 Vues
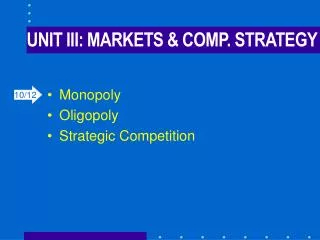
UNIT III: MARKETS & COMP. STRATEGY. Monopoly Oligopoly Strategic Competition. 10 /12. Monopoly. Market Structure Monopoly Multiplant Monopoly: 1 Firm – 2 Plants Price Discrimination: 1 Firm – 2 Markets Next Time: Review. Market Structure.

E N D
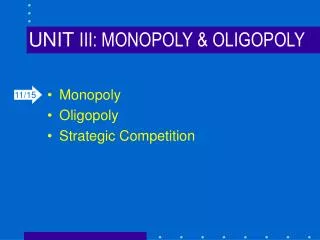
UNIT III: MARKETS & COMP. STRATEGY • Monopoly • Oligopoly • Strategic Competition 10/12
Monopoly • Market Structure • Monopoly • Multiplant Monopoly: 1 Firm – 2 Plants • Price Discrimination: 1 Firm – 2 Markets • Next Time: Review
Market Structure So far, we have looked at how consumers and firms make optimal decisions (maximize utility and profits) under constraint. Then we looked at how those individual decisions are coordinated via the market. Under Perfect Competition, we assume an infinite number of infinitely small price-takers, and we know that the competitive market equilibrium is Pareto-efficiency. Now want to consider other market structures (e.g., monopoly; duopoly) and characterize the corresponding equilibria; what are the welfare consequences of these market structures?
Market Structure Market structure is related to market concentration and competitiveness. Perfect Competition is a polar case (low conc; high comp), where rational decision-making at the individual level (consumer; firm) adds up to optimal outcomes at the social level – The Invisible Hand Theorem of Welfare Economics. Once we move away from the perfect case, firms can exploit market power: their behavior can influence prices (and profits). Monopoly is the case where a single firm has market power. Later we will consider what happens when several firms have power in the market (oligopoly). Here, competitive strategy comes to the fore.
Market Structure Perfect Comp Oligopoly Monopoly No. of Firms infinite (>)2 1 Output MR = MC = P ??? MR = MC < P Profit 0 ? Yes EfficiencyYes??? POINT 1: Under every market structure, all firms attempt to maximize profits, s.t., MR = MC. POINT 1: The number of firms in the market is determined by entry conditions.
Market Structure Perfect Comp Oligopoly Monopoly No. of Firms infinite (>)2 1 Output MR = MC = P ??? MR = MC < P Profit 0 ? Yes EfficiencyYes??? POINT 1: Under every market structure, all firms attempt to maximize profits, s.t., MR = MC. POINT 1: Profits signal entry. For a firm to remain profitable, there must be barriers to entry (or the market is too small for a second firm).
Market Structure Perfect Comp Oligopoly Monopoly No. of Firms infinite (>)2 1 Optimality MR = MC = P??? MR = MC < P Profit 0 ? Yes EfficiencyYes??? POINT 2: Under every market structure, all firms attempt to maximize profits, s.t., MR = MC.
Market Structure Perfect Comp Oligopoly Monopoly No. of Firms infinite (>)2 1 Optimality MR = MC = P??? MR = MC < P Profit 0 ? Yes EfficiencyYes ??? POINT 2: … but under perfect competition P = MR …
Market Structure Perfect Comp Oligopoly Monopoly No. of Firms infinite (>)2 1 Optimality MR = MC = P??? MR = MC < P Profit 0 ? Yes EfficiencyYes ??? POINT 2: … but under perfect competition P = MR and under monopoly P > MR.
Market Structure Perfect Comp Oligopoly Monopoly No. of Firms infinite (>)2 1 Optimality MR = MC = P ??? MR = MC < P Profit No ? Yes Efficiency Yes ??? POINT 3: Thinking about market structure raises welfare questions. Perfect competition implies efficiency.
Market Structure Perfect Comp Oligopoly Monopoly No. of Firms infinite (>)2 1 Optimality MR = MC = P ??? MR = MC < P Profit No ? Yes Efficiency Yes ??? POINT 3: What are the welfare implications of other market structures?
Market Structure Perfect Comp Oligopoly Monopoly No. of Firms infinite (>)2 1 Optimality MR = MC = P ??? MR = MC < P Profit No ? Yes Efficiency Yes ? ???
Market Structure Perfect Competition • Firms are price-takers: can sell all the output they want at P*; can sell nothing at any price > P*. • Homogenous product: e.g., wheat, t-shirts, long-distance phone minutes • Perfect factor mobility: in the long run, factors can move costlessly to where they are most productive (highest w, r). • Perfect Information: firms know everything about costs, consumer demand, other profitable opportunities, etc.
Market Structure Monopoly • Firms are price-setters: one firm supplies entire market, faces downward-sloping demand curve. • Homogenous product: necessarily so for a single firm. • Barriers to entry: no perfect factor mobility. E.g., patents; licenses; franchises. • Perfect Information: firms know everything about costs, consumer demand, other profitable opportunities, etc.
Monopoly Barriers to Entry: The number of firms is determined by entry conditions. As we have learned, profits are the incentive for entry. The only way a firm can remain profitable (and a monopoly) is if there are very strong barriers to entry, or if the market is too small for a second firm. • Some of these barriers are natural (technology) • Some are created by regulators (franchise, license) • Some are created by the monopolist to deter entry by potential rivals (competitive strategy)
Monopoly Remember that a perfectly competitive firm can sell all it wants at the market price. This means that any time it wants to increase revenues, it needs only to produce more output. For this reason in perfect competition marginal revenue and price were equal, MC = MR = P. Since a monopolist necessarily faces the entire market demand, it faces a downward sloping demand curve. This means that, if the firm wishes to increase revenues it must lower price. If it wishes to sell less it must raise price. As it turns out this means that, for a monopolist marginal revenue is different from market price, MC = MR < P.
Monopoly Marginal Revenue the additional revenue from a unit increase in output. Remember, the firm must sell it’s entire output at the same price. Therefore, marginal revenue will be the price of that extra unit minus the change in revenue on all earlier (inframarginal) units MR = dTR/dQ = d(PQ)/dQ = P + Q(dP/dQ) = P + P(Q/P)(dP/dQ)= = P[1 + Q/P(dP/dQ)] = P(1 + 1/E) dP/dQ is neg, for downward sloping demand curve
Monopoly Marginal Revenue the additional revenue from a unit increase in output. Remember, the firm must sell it’s entire output at the same price. Therefore, marginal revenue will be the price of that extra unit minus the change in revenue on all earlier (inframarginal) units MR = dTR/dQ = d(PQ)/dQ = P + Q(dP/dQ) = P + P(Q/P)(dP/dQ)= = P[1 + Q/P(dP/dQ)] = P(1 + 1/E) E = P/Q(dQ/dP) price elasticity of demand
Monopoly Marginal Revenue the additional revenue from a unit increase in output. Remember, the firm must sell it’s entire output at the same price. Therefore, marginal revenue will be the price of that extra unit minus the change in revenue on all earlier (inframarginal) units MR = dTR/dQ = d(PQ)/dQ = P + Q(dP/dQ) = P + P(Q/P)(dP/dQ)= = P[1 + Q/P(dP/dQ)] = P(1 + 1/E) > -1; MR < 0 E = -1; MR = 0 < -1;MR > 0
Monopoly Price-Taker Price-Setter $ $ P0 P1 P2 P1Q1 P2Q2 P0Q0 D D: P = AR Q Q TR TR = PQ Q Qo Q1 Q2 Q
Monopoly A monopolist will never produce at an inelastic portion of the demand curve $ $ MR > 0 (Elastic) D: P = AR = MR MR < 0 (Inelastic) D: P = AR Q Q MR TR TR AC Q Q
Multiplant Monopolist Now consider a monopolist who operates several plants. Q = qa + qb MCa = MCb = MR mcb $ P mca MC D qa q qb q Q Q Plant A Plant B Market MR Not to scale
Perfect Competition Competitive equilibrium. Firms are producing at the efficient scale. P* = acmin; P = 0. What would happen if a monopolist owned all the plants? $ $ P* mc ac LRS D q* q Q* Q
Multiplant Monopolist Monopoly equilibrium (S-R). Prices rise, total market quantity falls … $ $ Pm P* mc MCsr ac D q* q Qm Q* Q Not to scale
Multiplant Monopolist Monopoly equilibrium (S-R). Plants are producing at less than efficient scale. P* > ACmin; P > 0. There is no supply curve (Q = f(P)) for a monopolist $ $ Pm P* mc ac D qm q* q Qm Q* Q MR Not to scale
Multiplant Monopolist Monopplyequilibrium (S-R). Plants are producing at less than efficient scale. P* > ACmin; P > 0. $ $ Pm P* mc MCsr ac Profit D qm q* q Qm Q* Q Not to scale
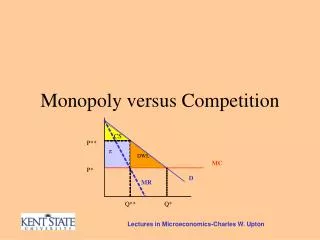
Multiplant Monopolist Monopoly equilibrium (S-R). Plants are producing at less than efficient scale. P* > ACmin; P > 0. Dead Weight Loss Max SS – Actual SS $ $ Pm P* mc MCsr ac Profit DWL D qm q* q Qm Q* Q MR Not to scale
Monopoly Monopoly equilibrium (L-R): Plants are producing at their efficient scale. P* > ACmin; P > 0. $ $ Pm P* mc DWL Profit ac MClr D q* q Qm Q* Q MR
Monopoly Monopoly equilibrium (L-R): Plants are producing at their efficient scale. P* > ACmin; P > 0. • QD = 1000 – 10P P = 100 - .1Q MR = 100 - .2Q • Qm = 400; Pm = 60 tc = 100 + q2 q* = 10 mc = 2q = 20 $ $ Pm P* mc DWL Profit ac MClr D q* q Qm Q* Q MR
Monopoly Monopoly v. perfectly competitive equilibrium: Q* = 800; P*= 20 Qm = 400; Pm = 60 In both cases, plants produce at the efficient scale: q* = 10 $ $ Pm P* mc DWL Profit ac MClr D q* q Qm Q* Q MR
Monopoly Natural Monopoly. Sometimes, one large firm can produce more efficiently than many small ones. $ tcnm= 1000 + 2q mcnm= 2 $ Pm P* QD = 1000 – 10P MR = 100 - .2Q = MC = 2 Qnm= 490 mc ac acm MC D qm q* q Qn Q*Q MR
Monopoly Natural Monopoly. Sometimes, one large firm can produce more efficiently than many small ones. $ tcm = 1000 + 2q mcm = 2 $ Pm P* What are the welfare implications? How can welfare be improved? mc ac acm MC D qm q* q Q Q*Q MR
Price Discrimination When a firm has market power, it will attempt to capture as much of the consumer surplus as it can. Goods susceptible to price discrimination: • Personal services (e.g., hair cuts) • Utilities (e.g., water; electricity)
Price Discrimination 3rd Degree (Market Segmentation): Now consider a monopolist who sells in several markets. MRa = MRb = MC Higher price in the less elastic market MC Pb $ Pa db da qa q qb q Q Q MRb MRa MR Market A Market B Firm
Price Discrimination 2nd Degree (Block Pricing): Firm charges different price for different units; all consumers face the same price schedule. $ 10 8 5 CS CS 0-100 $10 101-150 8 151- 5 PS CS PS CS D 100 150 Q
Price Discrimination 1st Degree (Perfect): Firm charges different price for to different consumers and different price for different units to the same consumer. $ Entire area under demand curve capture by producer What are the welfare implications? MC D Q
Market Structure POINT 1: The number of firms in the market is determined by entry conditions. Profits signal entry. For a firm to remain profitable, there must be barriers to entry (or the market is too small for a second firm). POINT 2: Under every market structure, all firms attempt to maximize profits, s.t., MR = MC. But under perfect competition P = MR and under monopoly P > MR. POINT 3: Thinking about market structure raises welfare questions. Perfect competition implies efficiency. What are the welfare implications of other market structures?
Next Time Perfect Comp Oligopoly Monopoly No. of Firms infinite (>)2 1 Output MR = MC = P ??? MR = MC < P Profit No ? Yes Efficiency Yes ? ???