Quality Management Problem Solving Tools and Techniques Chapter 13
Quality Management Problem Solving Tools and Techniques Chapter 13. Achieving Organizational Success. Problem Solving Tools and Techniques. If you don’t know where you are going, you will probably end up somewhere else. Laurence J. Peters Author and business theorist.

Quality Management Problem Solving Tools and Techniques Chapter 13
E N D
Presentation Transcript
Quality ManagementProblem Solving Tools and TechniquesChapter 13
Problem Solving Tools and Techniques • If you don’t know where you are going, you will probably end up somewhere else. • Laurence J. Peters • Author and business theorist
Problem Solving Tools and Techniques • Dr. Deming’s Plan-Do-Study-Act Cycle
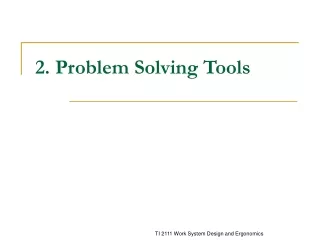
Problem Solving Tools and Techniques • Seven Tools of Quality • Flow Chart • Control Chart • Check Sheet • Histogram • Pareto Diagram • Cause and Effect Diagram • Scatter Diagram
Problem Solving Tools and Techniques • Seven Tools of Quality
Problem Solving Tools and Techniques • Seven Tools of Quality
Problem Solving Tools and Techniques Creating a flow chart • Define the Process Steps by Observing the Process • Sort the Steps into the Order of their Occurrence in the Process • Place the Steps in Appropriate Flow Chart Symbols • Create the Chart • Evaluate the chart for completion
Problem Solving Tools and Techniques • Flow Chart Symbols Activity ? Inspection Transportation Delay Storage
Decide to get a job Phoneinterview? Accept position? Schedule phone interview Yes No Yes No Decide what type of job to get Maybe Schedule interview Practice interviewing Wait allotted time for other offers Create resume Practice interviewing Have phone interview Make counter offer Research companies Go to interview Send “Thank You” note Did they Accept? Yes Decide where to apply Send “Thank You” note Realinterview? Yes No Send out resumes and cover letters No Continue to negotiate? Contact other Companies And inform Them you are No longer available Wait For Responses Yes Made an offer? Yes Wait For Responses No No More Interviews scheduled? Follow-up interview? Yes No Start new job! Yes No
Partially Completed Data Recording Check Sheet for Warranty Panel Information (Example)
WHY-WHY Diagram for Plastics and Dashes Instrument Panel, Work-in-Progress
A Control Chart, Showing Centerline, Upper Control Limits, and Lower Control Limits