Enhancing Program Performance Evaluation for Senior Transportation
Learn how to demonstrate program results effectively through performance measurement and evaluation strategies in the senior transportation sector. Understand the differences and benefits of evaluation and performance measurement. Explore key questions and best practices. Contact us for more information.

Enhancing Program Performance Evaluation for Senior Transportation
E N D
Presentation Transcript
EVALUATION 101: HOW CAN WE DEMONSTRATE PROGRAM RESULTS? Jon E. Burkhardt, Westat Dr. David J. Bernstein, Westat Prepared for the National Center on Senior Transportation Easter Seals / n4a December 9, 2008
Presentation Outline • NCST Project Objectives • The transportation improvement process • Performance measurement and evaluation: different activities, different uses • Applying performance measurement and evaluation to transportation programs • Summary • Contact information • Sources and references
NCST Project Objectives • Greater coordination between the aging community and the transportation industry • Increasing the family of transportation options for older adults at the local level • Ensuring caregivers are educated regarding transportation options • Addressing barriers to implementing more transportation services for older adults
The Transportation Improvement Process • Analyze existing conditions: determine local transportation needs and resources • Define community goals, objectives, and evaluation strategies • Confirm working relationships • Design and assess alternative services and strategies • Implement service changes • Evaluate and improve the services
Performance measures Evaluations Which? What? When? Why?
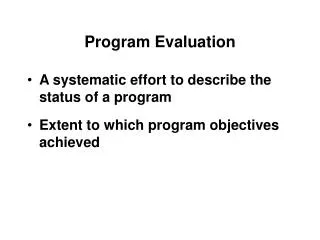
The “What:” Performance Measurement • Performance Measurement: periodic but regular monitoring and reporting of program accomplishments, particularly progress towards pre-established goals • Typical measures: • inputs (resources applied to a problem) • outputs (numeric measures of program products) • outcomes (what changed)
The “Why:” Evaluation • Evaluations: systematic studies to assess how well a program is working • Some of the possible components: • The process of implementing the program • Report on program objectives achieved [or not achieved] • Attribution of the results: • to the program? • to events outside of the program? • Recommendations for improving program results
The Differences • Performance measurement • will provide regular data for reports about the progress of a program • can explain what is happening within a program • Evaluations • are more in-depth • help explain why program performance did or did not change • help attribute performance measures to program results
Performance Measurement Data • Inputs:Measures of the resources that are applied in providing services • Activities: Measures of the services that are being provided • Outputs:Measures of the quantity of services provided or the quantity of a service meeting quality requirements • Outcomes:Measures that address the intermediate or long-term results of a program on those receiving a service
Program Outcome Model • Resources dedicated to or consumed by the program • Money • # of staff • Staff time • # of volunteers • Volunteer time • Facilities • Equipment • Supplies • Other • What the program does with the inputs to fulfill its mission • More staff & volunteers to provide trips • I & R services • New dispatch systems • Driver training • New vehicles • The direct products of program activities • More rides • More riders • Additional volunteers • Greater service span • Quicker I & R • Shorter wait time • Benefits for participants during and after program activities • Improved access • Greater sense of independence • Increased customer satisfaction • Increased flexibility • Improved communication among providers
How to Use Performance Measures • Improve decision making:Ensure that programs are being implemented. Provide input to day-to-day program management, funding decisions, and support strategic planning for services to clients. • Monitor Service Performance:track resources, program production and results, and monitor the need for more comprehensive examination and analysis (service interventions, evaluations). • Report Results/Be Accountable: Provide information to various parties, including staff, funders, service providers, program partners, clients, and other stakeholders.
Good Performance Measures • Focus on results • Are relevant and useful to program managers and stakeholders • Are readily measurable and countable • Provide valid, verifiable, and reliable information • Are clear and understandable, requiring only minimal explanation to be understood • Can be compared to targets, comparable programs, or legal or quality standards
Performance Measurement Questions • How many people are being served now compared with before we started? • How many trips are provided now? How many were provided previously? • Is my program meeting its targets? • Is my program efficient? Effective? Cost effective? • How does my program measure up against other programs?
Evaluation Questions • Can the results of our program be attributed to our program? • How can we meet the needs of our community? • Did our program meet its goals? Why or why not? • Did the way we implemented our program influence the results we got, or did not get? • How can we improve our program?
Primary Data Collection Decisions • Who will collect what kinds of data? • Which data will be collected at which points in time? • How will the data be used?
Potential Evaluation Components • System characteristics: Resources (inputs) • Performance measures: Efficiency(cost / mile, etc.) Effectiveness (trips / mile) Cost effectiveness ($ / trip) • Service quality: Consumer and management data • Service evaluations: Outcomes and impacts
Statistics for Performance Measures • Services delivered • Vehicle miles of service • Vehicle hours of service • Services consumed • Unlinked passenger trips • Unduplicated persons served • Fully allocated costs • All costs required to provide transportation service
Service Quality Components • Acceptability: reliability, connections, trust, comfort, respect • Accessibility: can physically use, can get information to use, proximity • Adaptability: flexibility, responds to specific requests, meets trip needs and special needs of clients • Affordability: not excessive money, time, or effort required to travel • Availability: frequency, hours / days / places available
An Example of Outcome Evaluation GOAL: Increase seniors’ knowledge and use of transportation options EVALUATION STEPS: • Do seniors know more about the options? • Have seniors increased their use of options? • Which outreach and education activities have been undertaken? • How do we know that the outreach and educationactivities are responsible for the changes?
Sources of Service Quality Data • Dispatch and driver logs • Records of complaints • User surveys
Survey: What’s your objective? • Needs analysis: Ask potential riders [or their advocates] to find out their needs • Customer satisfaction: Ask current transportation users about their satisfaction with services • Volunteer driver assessment: Ask volunteer drivers [and passengers] about their experiences • Service provider perspectives: Ask existing service providers what improvements are needed
Survey Considerations • Different strategies required for different groups • How to administer the survey (by mail, phone, internet, in-person, or some combination?) • When to administer (before, after, or before and after?) • Pilot test your survey and refine it based on the pilot test results
Summary Monitoring and evaluation should • Be based on valid data and replicable analyses • Support day-to-day program management and operations: expand / contract; continue / change • Help measure progress towards goals and objectives • Indicate potential service and program improvements • Provide accountability to funding sources • Support program continuation
Contact Information WESTAT 1650 Research Blvd Rockville, Maryland 20854 Jon Burkhardt Phone: 301/294-2806 JonBurkhardt@Westat.com David Bernstein Phone: 301/738-3520 DavidBernstein@Westat.com
Sources and References Slide 6: United Features Syndicate, 3/13/99 Slides 7-9: U.S. General Accounting Office. Performance Measurement and Evaluation: Definitions and Relationships. April 1998. http://www.gao.gov/archive/1998/gg98026.pdf and Wholey, J., Hatry, H., and Newcomer, K. (2004). Handbook of Practical Program Evaluation. http://www.josseybass.com/WileyCDA/WileyTitle/productCd-0787967130.html Slide 10: Governmental Accounting Standards Board [GASB]. (1994). Concepts statement no. 2, Service efforts and accomplishments reporting. http://www.seagov.org/resources/glossary.shtml and Montgomery County, MD. (March 2006). Montgomery Measures Up; http://www.montgomerycountymd.gov/content/omb/FY07/mmurec/howtoread.pdf
Sources and References (cont.) Slide 11: United Way of America (2006). Measuring Program Outcomes: A Practical Approach. http://www.liveunited.org/Outcomes/Resources/MPO/model.cfm Slide 12: Epstein, P.D. (1988). Using performance measurement in local government: A guide to improving decisions, performance, and accountability. New York, National Civic League Press. Slide 13: Bernstein, D.J. (2000). Local Government Performance Measurement Use: Assessing System Quality and Effects. Washington, DC: George Washington University. Available from ProQuest-University Microfilms Inc., http://www.umi.com/hp/Products/Dissertations.html. Slides 17 - 19: Burkhardt, J.E. (2004) Critical Measures of Transit Service Quality in the Eyes of Older Travelers.Transportation Research Record No. 1835, Transportation Research Board, Washington DC.