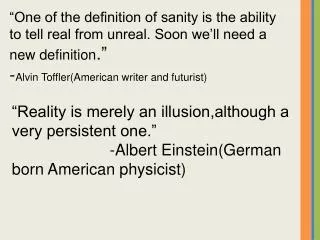
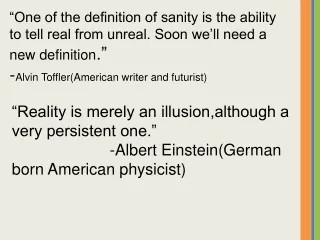
Reality is merely an illusion, albeit a very persistent one.
Reality is merely an illusion, albeit a very persistent one. Albert Einstein. Is the world we see the world we are told to see?. Are maps created without bias?. Definition: Bias A partiality that prevents objective consideration of an issue. Are maps created without bias?

Reality is merely an illusion, albeit a very persistent one.
E N D
Presentation Transcript
Reality is merely an illusion, albeit a very persistent one. E. Napp Albert Einstein
E. Napp Is the world we see the world we are told to see?
Are maps created without bias? Definition: Bias A partiality that prevents objective consideration of an issue E. Napp
Are maps created without bias? The Peters Map and the Mercator Map “Which is bigger, Greenland or China? With the traditional Mercator map (circa 1569, and still in use in many schoolrooms and boardrooms today), Greenland and China look the same size. But in reality China is almost 4 times larger! In response to such discrepancies, Dr. Arno Peters created a new world map that dramatically improves the accuracy of how we see the Earth.” E. Napp
A cartographer sees the world through the lens of her own consciousness. E. Napp Will the cartographer’s perspective influence the design of the map?
Medieval European T-O map E. Napp This mappae mundi was popular in Medieval Europe. This T-O image comes from the encyclopedia of knowledge produced by Isidore, Bishop of Seville, in 630 A.D., and was printed in Augsburg in 1472.
A 1482 C.E. world map based on Ptolemy’s Geography (150 C.E.) E. Napp The Indian Ocean appears as a lake and the cities of the Middle East are the center of the map.
A portolan map was used by sailors. The first known portolan map was made around 1270. E. Napp A portolan map was focused on the seas, ports, coves, and sailing distances. It was primarily used for sea navigation. Therefore, it did not focus on interior features.
In the case of a portolan map, the needs of the sailor were paramount in determining what was placed and emphasized on the map. E. Napp
Of course, the compass, a Chinese invention of its golden age, entered Western Europe in the 1200s. It increased European opportunities for exploration. E. Napp
The compass revolutionized sea travel. Since its needle always pointed in the same direction, a navigator could keep his course without consulting the position of the sun or stars. E. Napp
Of course, the Europeans were not the world’s first explorers of the oceans. Zheng He traveled throughout Asia and to East Africa. E. Napp
Zheng He was an explorer during China’s Ming Dynasty (1368-1644 C.E.) As a eunuch in the emperor’s service, he rose to prominence. Although he traveled extensively, a new emperor ended his travels, pursuing an increasingly isolationist policy in China. E. Napp
But exploration was not dead. With the European Age of Exploration, maps continued to be made. E. Napp Gerhardus Mercator created a map in 1569 that included a new projection that allowed navigators to understand the coasts of the Americas.
Columbus’ accidental arrival in the • Caribbean in 1492 revolutionized • Western European understandings of • the world. • The Americas were opened to the • Europeans and subsequently Africa • and Asia. • This would prove disastrous for the • indigenous peoples of the Americas and • Africa due to the Atlantic Slave Trade • while profitable for the Europeans. E. Napp
And maps continued to be made and changed. In Miller’s cylindrical projection map, the world is set on a grid. This decreases the amount of distortion in the high latitudes. E. Napp
If Miller’s cylindrical projection map is • cut to place the Prime Meridian in the • center, the result is a Eurocentric map. • This raises an important question: • What is the center of a map? • Dynastic China referred to itself as • the “Middle Kingdom.” Of course, • to refer to a kingdom as “Middle Kingdom” • is ethnocentric. • Can a map be ethnocentric? E. Napp
Of course, depending on where a Miller World Map is centered will determine what nation is most prominent (like this Miller World Map centered at the 90th West Meridian). E. Napp
So, when viewing a map, consider the • perspective of the mapmaker: • What continent or nation is displayed • in the map’s center? • What is the mapmaker emphasizing? • -location • -comparative sizes of regions • -a particular nation • -specific aspects of regions • (Consider some of the following maps.) E. Napp
E. Napp A Robinson Projection Map
Arthur H. Robinson in 1963 created the Robinson Projection Map. It is also called the Orthophanic projection, which means right appearing. • Scale is true along the 38º parallels and is constant along any parallel or between any pair of parallels equidistant from the Equator. Distortion is very low within about 45º of the center and along the Equator. • This projection is not equal-area, conformal, or equidistant; however, it is considered to look right for world maps, and is widely used by Rand McNally, the National Geographic Society, and others. E. Napp
E. Napp In 1974, Arno Peters created the Peters Projection Map so that one square inch anywhere on the map represents an equal number of square miles of the earth’s surface.
He created it from two perspectives to reduce bias. E. Napp
And there are physical maps. E. Napp
And there are all of these different • “containers” we use to make sense of • the world. • But always, we must remember that • these containers are mental constructs • and as such, imperfect and subject • to bias. • While many individuals consider • Europe and Asia to be separate • continents, are they really? E. Napp
And if maps have bias, what about historical periodization. Foundations The Classical Period (1000 BCE - 500BCE) The Postclassical Period (500-1500CE) The Early Modern Era (1500-1750) The Long Nineteenth Century(1750-1914) The Twentieth Century E. Napp
To understand the world, individuals create categories and containers but must always remember that mental constructs are not the same as the real thing. E. Napp
Questions: • What is bias? • From where does bias originate? • How does bias influence the creation of maps? • Explain several turning points in the history of • mapmaking. • Why is it important to examine the mapmaker’s • perspective? • Define Eurocentric and Ethnocentric. • Can bias be avoided? • What can individuals do to reduce bias? • Is the world we see the world we have been told • to see? • What is culture and how does culture create • a worldview that can contribute to bias? E. Napp