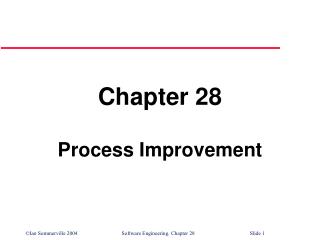
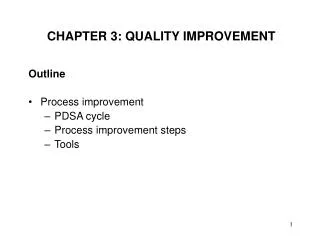
CHAPTER 3: QUALITY IMPROVEMENT
CHAPTER 3: QUALITY IMPROVEMENT. Outline Process improvement PDSA cycle Process improvement steps Tools. The P-D-S-A Cycle. Plan. Identify problem. Develop plan for improvement. Do. Act. Institutionalize improvement. Continue cycle. Implement plan on test basis. Study.

CHAPTER 3: QUALITY IMPROVEMENT
E N D
Presentation Transcript
CHAPTER 3: QUALITY IMPROVEMENT Outline • Process improvement • PDSA cycle • Process improvement steps • Tools
The P-D-S-A Cycle Plan Identify problem. Develop plan for improvement. Do Act Institutionalize improvement. Continue cycle. Implement plan on test basis Study Is the plan working?
Steps in Process Improvement • Plan 1: Recognize problem 2: Form quality improvement teams 3: Define problem 4: Develop performance measures 5: Analyze problem 6: Determine possible causes
Steps in Process Improvement • Do 7: Implement solution • Study 8: Evaluate solution • Act 9: Ensure performance 10: Continuous improvement
Plan: Steps 1 and 2 1: Recognize problem • Existence of the problem is outlined • In general terms, specifics are not clearly defined • Solvability and availability of resources are determined 2: Form quality improvement teams • Interdisciplinary • Specified time frame • Quality circle
Plan: Step 3 3: Define the problem • Define the problem and its scope • Pareto analysis • Brainstorming • Why-why diagram
50 40 30 20 10 0 100 80 60 40 20 0 Cumulative percentage Number of defects Pareto Chart
50 40 30 20 10 0 100 80 60 40 20 0 C Cumulative percentage Number of defects D A B Defect type Pareto Chart
50 40 30 20 10 0 100 80 60 40 20 0 C Cumulative percentage Number of defects D A B Defect type Pareto Chart
70 60 50 40 30 20 10 0 Pareto Chart (64) Percent from each cause (13) (10) (6) (3) (2) (2) Poor Design Defective parts Operator errors Machine calibrations Defective materials Surface abrasions Wrong dimensions Causes of poor quality
Why-Why Diagram • A technique to understand the problem • Does not locate a solution • The process leads to many reasons the original problem occurred • Example: A mail-order company has a goal or reducing the amount of time a customer has to wait in order to place an order. Create a why-why diagram about waiting on the telephone.
Why-Why Diagram Workers not scheduled at peak times Why? Waiting on the phone to place an order Insufficient operators available Why? Why? Low pay Many customers calling at the same time All catalogs shipped at the same time Why? Why?
Plan: Step 4 4: Develop performance measures • Set some measurable goals which will indicate solution of the problem • Some financial measures: costs, return on investment, value added, asset utilization • Some customer-oriented measures: response times, delivery times, product or service functionality, price • Some organization-oriented measures: employee retention, productivity, information system capabilities
Plan: Steps 5 and 6 5: Analyze problem • List all the steps involved in the existing process and identify potential constraints and opportunities of improvement • Flowchart 6: Determine possible causes • Determines potential causes of the problem • Cause and effect diagrams, check sheets, histograms, scatter diagrams, control charts, run charts
Flowchart Operation Storage Inspection Delay Transportation Decision
Enter emergency room Flowchart Fill out patient history Nurse inspects injury Return to waiting room Walk to triage room Wait for ER bed Walk to ER bed Doctor inspects injury Wait for doctor Walk to Radiology
Walk to radiology Flowchart Technician X-rays patient Doctor provides diagnosis Wait for doctor to return Return to ER bed Return to Waiting Leave Building Walk to pharmacy Pickup prescription Checkout
Cause and Effect Diagram • Common categories of problems in manufacturing • 5 M’s and an E • Machines, methods, materials, men/women, measurement and environment • Common categories of problems in service • 3 P’s and an E • Procedures, policies, people and equipment
Cause and Effect Diagram Measurement Men/Women Machines Out of adjustment Poor supervision Faulty testing equipment Lack of concentration Tooling problems Incorrect specifications Improper methods Old / worn Inadequate training Quality Problem Inaccurate temperature control Poor process design Defective from vendor Ineffective quality management Not to specifications Dust and Dirt Material- handling problems Deficiencies in product design Environment Materials Methods
COMPONENTS REPLACED BY LAB TIME PERIOD: 22 Feb to 27 Feb 1998 REPAIR TECHNICIAN: Bob TV SET MODEL 1013 Integrated Circuits|||| Capacitors |||| |||| |||| |||| |||| || Resistors || Transformers|||| Commands CRT | Check Sheet
40 35 30 25 20 15 10 5 0 1 2 6 13 10 16 19 17 12 16 20 17 13 5 6 2 1 Histogram Frequency of calls Telephone call duration, min
Scatter Diagram . Number of tears Rotor speed, rpm
Control Chart 27 24 UCL = 23.35 21 c = 12.67 18 15 Number of defects 12 9 6 LCL = 1.99 3 2 4 6 8 10 12 14 16 Sample number
Do: Step 7 7: Implement the solution • The solution should • prevent a recurrence of the problem • address the root cause of the problem • be cost effective • be implemented within a reasonable amount of time • Force-field analysis
Do: Step 7 • Force-field analysis • A chart that lists • the positive or driving forces that encourages improvement as well as • the restraining forces that hinders improvement • Actions necessary for improvement
Do: Step 7 Example: create a force-field diagram for the following problem: • Bicycles are being stolen at a local campus. Campus security is considering changes in the bike rack design, bike parking restrictions and bike registration to try to reduce thefts. Thieves have been using hacksaws and bolt cutters to remove locks from the bikes
Reading • Chapter 3: • Reading pp. 64-97 (2nd ed.), pp. 52-102 (3rd ed.)