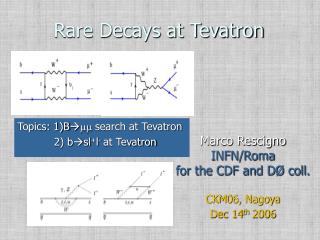
Diffraction at Tevatron
This publication discusses advanced studies on color singlet exchange in hard diffraction at the Tevatron, covering processes such as pp → pp + jet + jet and pp → p + X. It presents key results on color singlet fractions observed in opposite-side events across varying energies (√s = 630 GeV & 1800 GeV) and offers in-depth analysis on multiplicity distributions and dependence on several variables including transverse energy and parton density. The results provide insights into the QCD dynamics underpinning these processes and are supported by experimental data from DØ and CDF collaborations.

Diffraction at Tevatron
E N D
Presentation Transcript
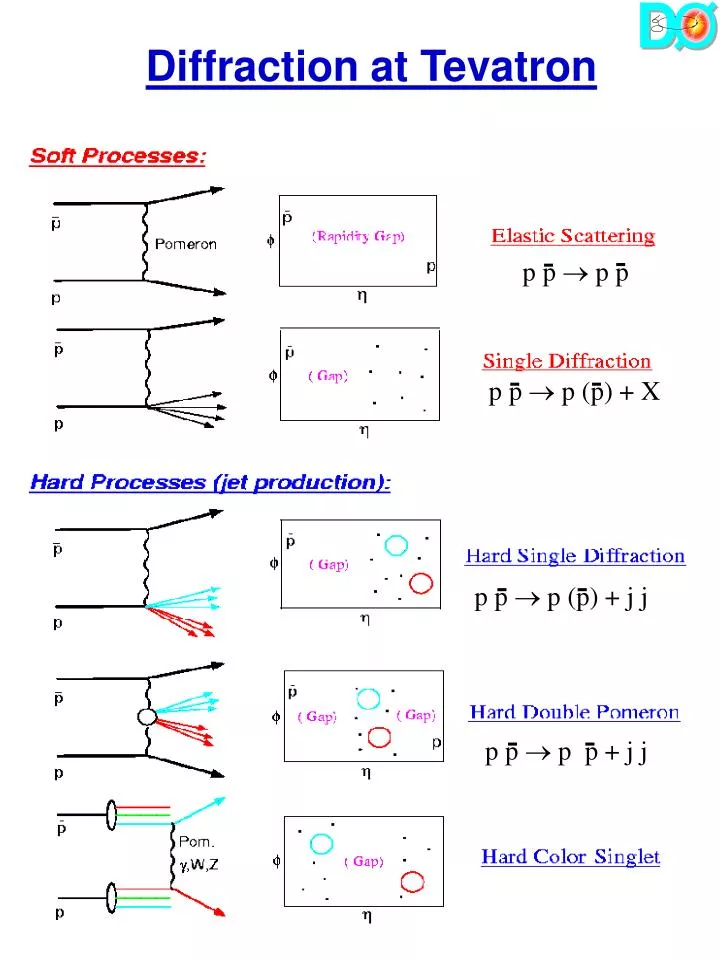
Diffraction at Tevatron p p p p p p p (p) + X p p p (p) + j j p p p p + j j
Hard Color Singlet Studies QCD color-singlet signal observed in ~ 1 % opposite-side events (p ) f Dh jet jet h Publications DØ: PRL 72, 2332(1994) CDF: PRL 74, 885 (1995) DØ: PRL 76, 734 (1996) Zeus: Phys Lett B369, 55 (1996) (7%) CDF: PRL 80, 1156 (1998) DØ: PLB 440, 189 (1998) CDF: PRL 81, 5278 (1998) H1: hep-ex/0203011 (sub. to Eur Phys J C) • Newest Results • Color-Singlet fractions at s = 630 & 1800 GeV • Color-Singlet Dependence on: Dh, ET, s (parton-x)
DØ Detector (nl0 = # tiles in L0 detector with signal 2.3 < |h| < 4.3) beam L0 Detector End Calorimeter Central Calorimeter EM Calorimeter Central Drift Chamber (ntrk = # charged tracks with |h| < 1.0) Hadronic Calorimeter (ncal = # cal towers with energy above threshold) Central Gaps EM Calorimeter ET > 200 MeV |h| < 1.0 Forward Gaps EM Calorimeter E > 150 MeV 2.0 < || < 4.1 Had. Calorimeter E > 500 MeV 3.2 < || < 5.2)
Measurement of fs Negative binomial fit to “QCD” multiplicity f Count tracks and EM Calorimeter Towers in |h| < 1.0 Dh jet jet h High-ET sample (ET > 30 GeV, s = 1800 GeV) fS = color-singlet fraction =(Ndata- Nfit)/Ntotal fS 1800 = 0.94 0.04stat 0.12sys % ET >30 GeV (Includes correction for multiple interaction contamination. Sys error dominated by background fitting.)
630 vs. 1800 Multiplicities Jet ET > 12 GeV, Jet |h| > 1.9, Dh > 4.0 Opposite-Side Data Same-Side Data 1800 GeV: ncal ntrk ntrk ncal 630 Gev: ncal ncal ntrk ntrk fS 1800(ET =19.2 GeV) = 0.54 0.06stat 0.16sys % fS 630(ET = 16.4 GeV) = 1.85 0.09stat 0.37sys % 630 R1800 = 3.4 1.2
Color Singlet Models If color-singlet couples preferentially to quarks or gluons, fraction depends on initial quark/gluon densities (parton x) larger x more quarks Gluon preference: perturbative two-gluon models have 9/4 color factor for gluons • Naive Two-Gluon model (Bj) • BFKL model: LLA BFKL dynamics Predictions: fS (ET) falls, fS (Dh) falls (2 gluon) / rises (BFKL) Quark preference: • Soft Color model: non-perturbative “rearrangement” prefers quark initiated processes (easier to neutralize color) • Photon and U(1): couple only to quarks Predictions: fS (ET) & fS (Dh) rise
Model Fits to Data Using Herwig 5.9 s = 1800 GeV Soft Color model describes data
Survival Probability • Assumed to be independent of parton x (ET , Dh) • Originally weak s dependence • Gotsman, Levin, Maor Phys. Lett B 309 (1993) • Subsequently recalculated • GLM hep-ph/9804404 • Using soft-color model • (uncertainty from MC stats and model difference) • with
BFKL: Cox, Forshaw (manhep99-7) use a non-running as to flatten the falling ET prediction of BFKL (due to higher order corrections at non-zero t) Soft Color: Gregores subsequently performed a more careful counting of states that produce color singlets to improve prediction. Modifications to Theory
Hard Single Diffraction Measure multiplicity here Measure min multiplicity here -4.0 -1.6 h 3.0 5.2 OR -5.2 -3.0 -1. h 1. 3.0 5.2 Phys Lett B 531 52 (2002) • Gap fractions (central and forward) at s = 630 & 1800 GeV • Single diffractive x distribution
630 vs. 1800 Multiplicities s = 1800 GeV: s = 630 GeV:
Event Characteristics 1800 Forward Jets Solid lines show show HSD candidate events Dashed lines show non-diffractive events • Less jets in diffractive events • Jets are narrower and more back-to-back • Diffractive events have less overall radiation • Gap fraction has little dependence on average jet ET
Comparison to MC fvisible = gap · fpredicted gap *Add diffractive multiplicity from MC to background data distribution *Fit to find percent of signal events extracted Find predicted rate POMPYT x 2 / PYTHIA *Apply same jet cuts as data, jet ET>12GeV *Full detector simulation * Model pomeron exchange in POMPYT26 (Bruni & Ingelman) * based on PYTHIA * define pomeron as beam particle * Use different structure functions
Pomeron Structure Fits • Demand data fractions composed of linear combination of hard and soft gluons, let overall s normalization and fraction of hard and soft at each energy be free parameters • If we have a s independent normalization then the data prefer : • 1800: hard gluon 0.18±0.05(stat)+0.04-0.03(syst) • 630: hard gluon 0.39±0.04(stat)+0.02-0.01(syst) • Normalization: 0.43±0.03(stat)+0.08-0.06(syst) with a confidence level of 56%. • If the hard to soft ratio is constrained the data prefer: • Hard gluon: 0.30±0.04(stat)+0.01-0.01(syst) • Norm. 1800: 0.38±0.03(stat)+0.03-0.02(syst) • Norm. 630: 0.50±0.04(stat)+0.02-0.02(syst) with a confidence level of 1.9%. • To significantly constrain quark fraction requires additional experimental measurements. • CDF determined 56% hard gluon, 44% quark but this does not describe our data without significant soft gluon or 100% quark at 630
x Calculation Where is the momentum fraction lost by the proton *Can use calorimeter only to measure *Weights particles in well-measured region *Can define for all events *Collins (hep-ph/9705393) true = calc · 2.2± 0.3 * calculation works well * not dependent on structure function or center-of-mass energy
Single Diffractive x Distributions central s = 1800 GeV forward central s = 630 GeV forward distribution for forward and central jets using (0,0) bin Dp p = 0.2 for s = 630 GeV
CDF Diffractive W CDF used asymmetry to extract diffractive component of the W signal 1)TOPOLOGY -lepton favors the hemisphere opposite the rapidity gap -compare multiplicity for region on same side of lepton vs opposite side 2)CHARGE -proton(uud) pomeron(qq) gives twice as many W+ as W- -W+ production is associated with gaps in p direction (and W- with p) Drawback: Asymmetry approach reduces statistical power of data
CDF Diffractive W CDF {PRL 78 2698 (1997)} measured RW = 1.15 ± 0.55% where RW = Ratio of diffractive/non-diffractive W a significance of 3.8
DØ Central W Multiplicity Minimum side -1.1 0 1.1 3.0 5.2 nL0 ncal nL0 L0 ncal ncal Peak at (0,0) indicates diffractive W-boson Signal: 68 of 8724 events in (0,0) bin DØ Preliminary
W Event Characteristics Standard W Events Diffractive W Candidates Electron ET ET=35.16 Neutrino ET ET=36.08 ET=37.12 MT=70.64 Transverse Mass MT=70.71 ET=35.27 DØ Preliminary
W/ZData Results *Observed clear Diffractive W and Diffractive Z signals *Measured Diffractive W/All W and Diffractive Z/All Z Sample Diffractive Probability Background All Fluctuates to Data Central W (1.08 + 0.19 - 0.17)% 1 x 10-147.7s Forward W (0.64 + 0.18 - 0.16)% 6 x 10-85.3s All W (0.89 + 0.19 – 0.17)% 3 x 10-147.7s Z (1.44 + 0.61 - 0.53)% 5 x 10-64.4s DØ Preliminary
Rate Comparison Correct MC for gap efficiency 20-30% for quark and hard gluon (soft gluon fractions <0.02%) FINAL GAP FRACTION Sample DataQuark Hard Gluon Cen W(1.08 + 0.21 - 0.19)%(4.1 0.8)%(0.15 0.02)% For W (0.64 + 0.19 - 0.16)%(7.2 1.3)% (0.25 0.04)% Z (1.44 + 0.62 - 0.54)%(3.8 0.7)% (0.16 0.02)% NOTE: Observe well-known normalization problem for all structure functions, also different dependence on h for data and MC, as in dijet case DØ Preliminary
Double Gaps at 1800 GeV|Jet h| < 1.0, ET>15 GeV Gap Region 2.5<|h|<5.2 Demand gap on one side, measure multiplicity on opposite side DØ Preliminary
Double Gaps at 630 GeV|Jet h| < 1.0, ET>12 GeV Gap Region 2.5<|h|<5.2 Demand gap on one side, measure multiplicity on opposite side DØ Preliminary
Tevatron Summary • Measurements at two CM energies with same detector adds critical new information for examining pomeron puzzle • The higher rates at 630 were not widely predicted before the measurements • Pioneering work in Central Rapidity Gaps • Modifications to theory based on data have occured • Hard Single Diffraction • Many processes observed and studied including Diffractive W (diffraction is not low pT process) • Discrepancy in shape and normalization of distribution confirms factorization breakdown • Results imply a non-pomeron based model should be considered • Hard Double Pomeron • Observation of interesting new process • Confirms factorization breakdown
Conclusion • Diffraction is a complex subject! • Much new experimental and theoretical work with promise of new more precise data to aid understanding Many open questions: • Are the hard and soft Pomeron distinct objects? • How to combine perturbative and non-perturbative concepts? • How to extract unique parton distribution densities from HERA and Tevatron data? • How to understand gap survival probability? • Is there a particle-like pomeron?