Download
1 / 34
350 likes | 592 Vues
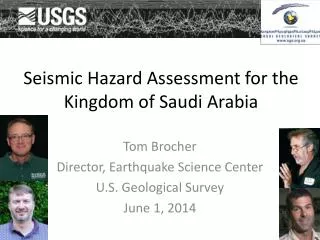
Seismic Hazard Assessment for the Kingdom of Saudi Arabia. Tom Brocher Director, Earthquake Science Center U.S. Geological Survey June 1, 2014. The Goal. Provide a state-of-the-art seismic hazard assessment for the Kingdom

E N D
Seismic Hazard Assessment for the Kingdom of Saudi Arabia Tom Brocher Director, Earthquake Science Center U.S. Geological Survey June 1, 2014
The Goal • Provide a state-of-the-art seismic hazard assessment for the Kingdom • Focus on characterizing earthquake faults within the Kingdom – earthquake chronology, slip per event, slip rates, magnitudes, style of faulting • Another focus will be ground motion prediction equations and site response within the Kingdom • Assessing extreme wave hazard along the coasts • Training is a major goal of the work
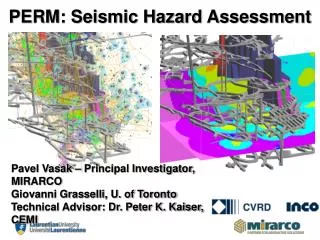
Characterizing Earthquake Faults • Identifying and mapping young faults • Quaternary Geologic maps • Photos and Imagery • LiDAR • InSAR • Aeromagnetic mapping • Seismic reflection profiling
Characterizing Earthquake Faults Conducting field and laboratory studies of faults • Field mapping • Geomorphic analysis • Trenching • Age dating of offset soils
Predicting Strong Ground Motions • Compile existing strong ground motion data within the Kingdom and nearby regions • Derive ground motion prediction equations • Characterize crustal structure to regionalize the ground motion data • Characterize site response (Vs30) in the Kingdom • Imaging sedimentary basins for long period response
Characterize strain rates in the Kingdom • Use GPS and InSAR data to estimate strain rates in the Kingdom • Compile earthquake catalog and generate a smoothed seismicity map for the Kingdom
PSHA Analysis • Earthquake faults • Smoothed seismicity • Strain rates • Ground motion predictions • Site response (Vs30) Pascucci, Free, Lubkowski, 2008
Who are we? • The Earthquake Science Center has many years of experience performing seismic hazard assessments in California and the US • Expertise in: • Paleoseismic investigations of faults • Geophysical characterization of faults • Prediction of strong ground motions • Geodesy and strain measurements • Earthquake monitoring • Probabilistic Seismic Hazard Analysis
Earthquake Science Center Organization • Earthquake Monitoring (53 staff) • Earthquake Monitoring Project (28 staff) • Southern California Seismic Network (14 staff) • Deformation (13 staff) • Earthquake Hazard Assessment (48 staff) • Shaking, Damage, Failure (Earthquake Effects) (20 staff) • Southern California Earthquake Hazards Assessment (11 staff) • Pacific Northwest Hazards Project (10 staff) • Bay Area Earthquake Hazards (7 staff) • Earthquake Research (22 staff) • Earthquake Processes Probabilities and Occurrence (13 staff) • Induced Seismicity (9 staff)
M 7.6 The first step in making hazard maps: construct a hazard curve at each site Hazard Methodology Procedure Cartoon a b Earthquake Sources a Ground motion Hazard curve r1 d1 d4 annual probability of exceeding pga peak ground acceleration r2 d2 M7.6 d3 high seismicity zone San Andreas fault 0.25g 0.5g distance peak ground acceleration (pga) r3
Constructing a hazard curve: a real example 1/200=0.005 Source B M7.5, Tr=200 yr 50km 10km Site Source A M5.5, Tr=10 yr 1/10=0.10 Annual probability that earthquake occurs: Source A: 1/10 = 0.10 Source B: 1/200 = 0.005
Do this for all possible ground motions from Source A to make a hazard curve for Source A
Combine hazard curves for all source t make the final hazard curve
Make a map of the ground-motion values for a given FOE; this is the hazard map that is the basis for the design maps included in building codes
We invert for the Vertical and East components of deformation using the interferograms (2-5) shown in the previous slide. 5
Model fault line in downtown Spokane, GoogleEarth Looking NE 11