Download
1 / 1
10 likes | 140 Vues
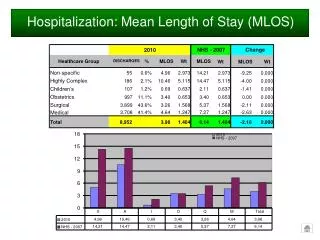
NHS - 2007. Change. 2010. Healthcare Group. DISCHARGES. %. MLOS. Wt. MLOS. Wt. MLOS. Wt. Non-specific. 55. 0.6%. 4.96. 2.973. 14.21. 2.973. -9.25. 0.000. Highly Complex. 186. 2.1%. 10.46. 5.115. 14.47. 5.115. -4.00. 0.000. Children’s. 107. 1.2%. 0.69.

E N D
NHS - 2007 Change 2010 Healthcare Group DISCHARGES % MLOS Wt MLOS Wt MLOS Wt Non-specific 55 0.6% 4.96 2.973 14.21 2.973 -9.25 0.000 Highly Complex 186 2.1% 10.46 5.115 14.47 5.115 -4.00 0.000 Children’s 107 1.2% 0.69 0.637 2.11 0.637 -1.41 0.000 Obstetrics 997 11.1% 3.40 0.653 3.40 0.653 0.00 0.000 Surgical 3.899 43.6% 3.26 1.568 5.37 1.568 -2.11 0.000 3.708 41.4% 4.64 1.247 7.27 1.247 -2.63 0.000 Medical Total 8,952 3.98 1.404 6.14 1.404 -2.16 0.000 18 2010 NHS - 2007 15 12 9 6 3 0 X A I O Q M Total 4,96 10,46 0,69 3,40 3,26 4,64 3,98 2010 14,21 14,47 2,11 3,40 5,37 7,27 6,14 NHS - 2007 Hospitalization: Mean Length of Stay (MLOS)