Download
1 / 21
220 likes | 447 Vues
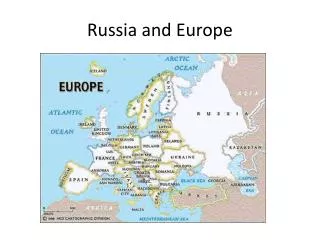
Europe and Russia in the Media Center Geography, Mapping, and Images. Amanda Clarke Henley GIS Librarian Reference Department, Davis Library. Today’s Presentation. Online Cartographic Resources Virtual Globes Google Earth Tour Hyperlinks Image Overlays Instructions and Resources

E N D
Europe and Russia in the Media CenterGeography, Mapping, and Images Amanda Clarke Henley GIS Librarian Reference Department, Davis Library
Today’s Presentation • Online Cartographic Resources • Virtual Globes • Google Earth • Tour • Hyperlinks • Image Overlays • Instructions and Resources • Questions Image: http://englishrussia.com/?p=1466
Cartographic Resources • Perry-Castañeda Library Map Collection (UT Arlington) • Very large collection of digital maps • http://www.lib.utexas.edu/maps/ • David Rumsey Historical Map Collection • http://www.davidrumsey.com • Over 13,600 maps online • Focus: rare 18/19th century N and S America • Historic World maps • Europe, Asia, and Africa • Map History Gateway • Retired Map Librarian, British Library, London • Annotated links to many, sites with online maps • http://www.maphistory.info/index.html • National Geographic and ESRI Map Machine: • Interactive atlas http://plasma.nationalgeographic.com/mapmachine/index.html • United Nations Cartographic Section • Good source for recent maps, not all countries are listed • http://www.un.org/Depts/Cartographic/english/htmain.htm
Interactive Globes • NASA World Wind • ArcGIS Explorer • Google Earth “3D Interface to the Planet” Satellite imagery and spatial data on a 3-D virtual globe Easy to use interface
NASA World Wind Free Open Source Public Domain Data
ArcGIS Explorer • Not Open Source • From ESRI, world leader in GIS • Commercial data • GIS Oriented • Allows for some GIS capabilities: visibility modeling proximity search
Google Earth • Not Open Source • Originally Keyhole Earth • Developed for US Intelligence • Commercial Data • Social Object • Google Earth Community • Panoramio • Wikipedia
Inspiration for Keyhole Earth/Google Earth • Michael Jones, CTO of Google Earth, presented: “A Sense of Place” at the second Map Middle East Conference, 2006 • Goal to Geographically Organize World Data • Described Google Earth as GIS “for the 5.999999 billion people of the world’s 6 billion population who don’t know or care what GIS is”. • Inspiration for Google Earth: • “Father of GIS” Roger Tomlinson, who in the late 1960’s wrote that the ultimate GIS which would be a computer globe of interactive data… • Mr Spock’s Tricorder… “could tell the science officer all the information he needed to describe his local environment”. http://www.edparsons.com/?p=203 Scott Madry pers com.
Data Models Simplify Real World Phenomenon into Abstractions Raster (Grids and Images) Vector (Points, Lines, and Polygons) Modeling the Earth with Spatial Data Two Main Spatial Data Models:
Raster Data • Raster Data divide the earth’s surface into a grid • Each grid cell is assigned a value that represents some characteristic of the earth at that location (elevation above sea level) or imagery • “Spatial Resolution” is based on cell size – level of generalization Satellite Imagery – Landsat TM
Vector Data • Vector data use coordinates to express the location of objects (x, y) • Features can be represented by: • a single set of coordinates (point) • two sets of coordinates (line) • Three or more sets of coordinates (polygon or polyline)
Google Earth Data • Google Earth Provides both raster and vector data • Imagery at various resolutions cover the Globe • Vector data includes • Points of interest, Boundaries, etc. • Additional geospatial data can be overlayed- XML-based format • KML (Keyhole Markup Language) • KMZ Zipped KML File • Points, Lines, Polygons and Images can all be represented in KML/KMZ • Use the interface to create placemarks, save as KML or KMZ
Google Earth Data Imagery • Satellite Imagery and Aerial Photos compiled from many different sources, mosaiced to cover the entire globe • 15m spatial resolution at coarsest, much higher for many areas • U.S. high resolution for many locations (1m, 0.7m, 0.3m). 0.15m aerials for Cambridge, MA and Google Campus, Las Vegas has 5in • Global: some 1m, some 0.7m in urban areas, UK has 15cm (6in) • Most less than 3 years old • Imagery being updated all the time Google Inc. Mountainview, CA Source: Google Earth website, Google Earth Blog (Frank Taylor) and pers comm, Scott Madry
Newer Is Better!? 2002 Imagery 2007/2008(?) Imagery
3-Dimensional Mosaic of Imagery Resolution Affects Sharpness of Imagery Sub-meter resolution (~100cm) ~10m resolution
Metadata Would Be Nice • Instead, we get: • Google Earth Image Coverage: • http://earth.google.com/data.html • List of Cities with available high-resolution data: • http://earth.google.com/coverage/coverage_list.pdf • Image Dates, Images are from “sometime in the last three years” …“And because the imagery comes from a variety of sources, and is mosaic-ed together, it is difficult for us to specify the date of a city or region (a single city may have imagery taken from different months).” • Source: http://earth.google.com/images_dates.html
Google Earth Data Elevation Data • Based on Shuttle Radar Topography Mission (SRTM), 30m, sometimes 90m • No Bathymetry data (seabed is a graphic) Swiss Alps Tyrrhenian Sea Source: Wikipedia Google Earth entry, and pers comm, Scott Madry
Google Earth in the Classroom (or Media Center!) • Google Earth Lessons: • Google UK Lessons (11-14) • The British Empire • Elizabeth and the Spanish Armada • Comparing Castles • The Slave Trade • Google Earth 101 for Educators