Bo N. Jacobsen EEA
270 likes | 434 Vues
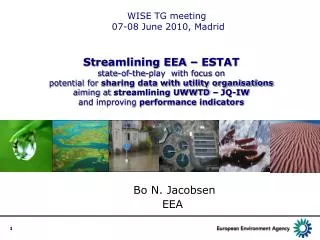
WISE TG meeting 07-08 June 2010, Madrid. Streamlining EEA – ESTAT state-of-the-play with focus on potential for sharing data with utility organisations aiming at streamlining UWWTD – JQ-IW and improving performance indicators. Bo N. Jacobsen EEA. Data streamlining within WISE - examples.

Bo N. Jacobsen EEA
E N D
Presentation Transcript
WISE TG meeting 07-08 June 2010, Madrid Streamlining EEA – ESTATstate-of-the-play with focus onpotential for sharing data with utility organisationsaiming at streamlining UWWTD – JQ-IWand improving performance indicators Bo N. Jacobsen EEA
Data streamlining within WISE- examples WFD Table 4-6 SoE emissions water quantity Table 2-3 Table 7 E-PRTR UWWTD EEA Eurostat JQ-IW Sum National database
Overview – state-of-the-play Streamlining attempts ongoing for • SoE emissions • SoE (Eionet) request designed with high alignment with JQ-IW • Emission WaterBase made available by 22 march 2010 • SoE Water Quantity • UWWTD • Ref. To ETC-W presentation WISE TG Stockholm • UWWTD WaterBase made available by 22 march 2010
EEA pilot initiative by potential data sharing with utility organisations Aims • Facilitate further UWWTD – JQ-IW streamlining • Further devoping performance indicators • Get added value from existing: • E-PRTR reporting (transfers to water) • Data on population density • GIS layer superimposing techniques • Contribute to water–energy nexus for water utility sector • Strengthen WISE relations to water utility segment
Main messagesUWWTD – JQ-IW streamling • The two data flows are closely related on urban wastewater • Two basic differences hinders a streamlining: • Population equivalents (p.e.) versus population (inhabitants) • Agglomeration versus urban WWTP catchment • Expanding current UWWT WaterBase with population per UWWTP sewerage catchment will enable prefilling of parts of JQ-IW table 4, 5 & 7
How to get data on population (inhabitants) per WWTP ? • Already in national databases operated by national UWWTD reporters • Already in databases of national water utility associations • Already known by individual UWWTP operators • To be calculated from shapefiles of UWWTP sewerage catchments by GIS overlay with existing European grids of population density
Agree on a story and the important (policy) questions • Identify relevant indicators (headlines) answering these • Compare with currently available indicator assessments Decide on assessment methods (targets, criteria) and data needed / available How to derive indicators ? Data compilation and Assessment Conclusion and communication of key messages
Performance: treatment of waste water CSI 024 link Changes in wastewater treatment in regions of Europe between 1990 and 2005 Key policy question: How effective are existing policies in reducing loading discharges of nutrients and organic matter ?
Pop-up information on individual WWTPs UWWTP-link
Trend in mean Total Phosphorus concentration in rivers plotted against loads discharged from UWWTPs- Austria Note: Percentage of population connected to tertiary treatment increased by 24 % since 1998
preferred Performance of catchment Performance of catchment + WWTP Carbon footprint Looking forward on further development of performance indicators Think holistic – start focussed ! • start simple and with big WWTPs • Make data specific per: m3 / p.e. / inhabitant in sewerage catchment • Modify: total loads minus big industries (E-PRTR) Focus on: • Actual, specific pollution loads • UWWTP influent and effluent • Corresponding, specific energy consumptions
Potential performance indicators- specific loads excluding E-PRTR transfers; based on 2007 data;*) excluding WWTP storm overflows Lynetten DK10105 Inf. (g/d/p): 96 (BOD), 15 (N), 2.6 (P) Eff. (g(d/p): 3.5 (BOD), 2.2 (N), 0.3 (P) Power (W/p): 6.1 (total) 6.1 (net) Spildevandscenter Avedøre DK1670001 Inf. (g/d/p): 68 (BOD), 13 (N), 2.4 (P) Eff. (g(d/p): 1.7 (BOD), 2.4 (N), 0.3 (P) *) Power (W/p): 7.6 (total) 4.3 (net) Carbon footprint (kg CO2-e/y/p): 23 (net) Damhusåen DK310106 Inf. (g/d/p): 68 (BOD), 12 (N), 2.2 (P) Eff. (g(d/p): 4.5 (BOD), 2.8 (N), 0.4 (P) *) Power (W/p): 4.7 (total) 2.5 (net) (Source: utility websites)
Options for data flows in WISE • Via national reporters to UWWTDs • Via Eionet national focal points • Via national associations • Coordinated by EUREAU, WSSTP, IWA,.. • By individual uploads (EoE-approach) to be discussed...
Strategic opportunities for future challenges:(presented at IWA Water Utility managent Conference, Barcelona 11-12 may 2010) • WISE is a transparent information system of high relevance for water utilities – be free to use it ! • Several datasets based on EU water directive reporting can get added value by voluntary supplementary strategic data flows • Hereby proposed to utilities to share data on: • Specific loads from sewerage catchments • Specific emissions from UWWTPs • Specific energy consumption Potentially leading to performance indicators across Europe and beyond ..
Thank you to:Avedoere Wastewater ServicesLynettefaellesskabetRuhrverbandfor sharing data – hopefully more to come in pilot exercise via utility organisations
Thank you for your attention Do you agree on the WISE perspectives ? bo.jacobsen@eea.europa.eu
UWWTD • Reporting stream is well established according to requirements of UWWTD • Additional voluntary reporting has been incorporated in xml-schemas • Reporting via Reportnet has been established as a dataflow • Xml-schemas may be revised for next reporting in 2011 • Reporting is un-aggregated, e.g. per agglomeration or WWTP level
JQ-IW • Reporting stream is well established according to voluntary agreements and guidance is given in a JQ-IW Manual • Reporting is aggregated per country – now also to be regionalised per RBD • Nomalising units are p.e. and WWTPs (to destinguish type of treatment)
UWWTD (p.e.) • p.e. is a term normalising organic pollution load (BOD) from industrial sources into the comparable unit of BOD load from 1 person • Definition 1 p.e. = 60 BOD (5,ATU) / day) • CEN standard (EN:1085) operates with PE (same as p.e.) for more parameters,e.g.: • PEB60 = 60 g BOD/day • PEN12 = 12 g total N/day, • PEP2,7= 2.7 g total P/day, Standardisation is only on the nomenclature
UWWTD (p.e.) - Pro et contra • Pro: • widely used, throughout decades • has been used in UWWTD as unit for generated pollution load as criteria to prescribe certain ww- infrastructure service levels • Contra: • The load from 1 person varies between countries and also over the years • In particular P load per person has decreased over time • Lack of homogenity for quantifying p.e. from service sector with domestic sewage (included or not) • Quantification of pollutant load only related to BOD is losing importance compared to N and P
UWWTD (agglomeration) • Agglomeration is a term introduced in UWWTD in order to establish size criteria for communities to be served by various levels of wastewater infrastructure service • The load expressed in p.e. reflects typically the ”capacity” of the agglomeration based on design criteria, e.g., based on p.e/ha for different classes of land use
Agglomeration - Pro et contra • Pro: • The concept ensures that the same size of communities are evaluated alike, independently of how many individual WWTPs and corresponding catchments • Contra: • Such design criteria are expected to vary considerably across Europe • Lack of homogenity for quantifying p.e. from service sector with domestic sewage (included or not) and some inhomogenicities arise,e.g. on how generated load from domestic wastewater from service sector is accounted for. • Unless the agglomeration and catchment of UWWTD is the same, monitoring data from influent WWTP load cannot be used to characterise the load. • Therefore, load expressed in p.e. generated from agglomarations is technically not such a good normalising parameter for the actual loads for the year of reporting • The normalisation per inhabitant (=capita) is already widely used in many other environmental and consumption statistics