Download
1 / 18
180 likes | 394 Vues
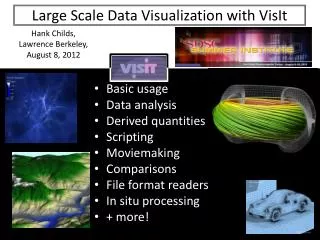
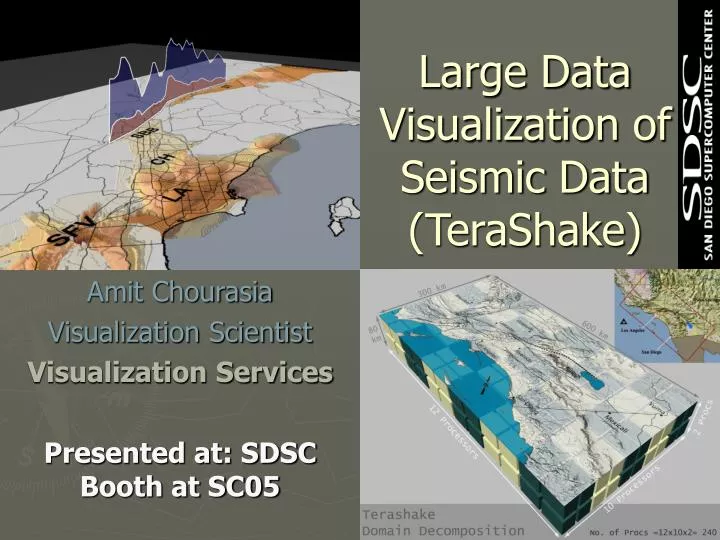
Large Data Visualization of Seismic Data (TeraShake). Amit Chourasia Visualization Scientist Visualization Services Presented at: SDSC Booth at SC05 . movie. About Terashake. Large Scale Earthquake Simulation on Southern San Andreas 33 researchers, 8 Institutions

E N D
Large Data Visualization of Seismic Data (TeraShake) Amit Chourasia Visualization Scientist Visualization Services Presented at: SDSC Booth at SC05
About Terashake Large Scale Earthquake Simulation on Southern San Andreas 33 researchers, 8 Institutions • Southern California Earthquake Center • San Diego Supercomputer Center • Information Sciences Institute • Institute of Geophysics and Planetary Physics (UC) University of Southern California • San Diego State University • University of California, Santa Barbara • Carnegie-Mellon University • ExxonMobil Slide: Courtesy Marcio Faerman
TeraShake Simulation Area • Rectangular region parallel to San Andreas fault containing: • Los Angeles, • San Diego, • Mexicali, • Tijuana, • Ventura Basin, • Fillmore, • Southern San Joaquin Valley, • Catalina Island, • Ensenada • 600 x 300 x 80 km Slide: Courtesy Marcio Faerman
TeraShake Earthquake Simulation • Magnitude 7.7 earthquake on southern San Andreas • Mesh of 1.8 Billion cubes, 200 m • 0.011 sec time step, 20,000 time steps: 3 minute simulation • 240 processors on San Diego SuperComputer Center DataStar • ~ 20,000 CPU hours, over approximately 5 days wall clock • ~ 47 million megabytes of output • Asynchronous rendering of simulation output during ongoing computation Slide: Courtesy Marcio Faerman
-0.1+0.1 Go! Visualize • Velocity components (Volumes and Surfaces)
-50.0 +50.0 cm/s Visualize ?what? • Velocity within specific range • Color ramps easily understood by scientists. 250.0 +250.0 cm/s
Visualize ?what? • Context – Geographic location • Context – Fault lines • Simulation Time
0.0 250.0 cm/s -50.0 +50.0 cm/s Visualize ?what? • Velocity components and magnitudes • Velocity Cumulative peaks • Velocity range and color schema
Tangible Numbers • 55 Different animations • Over 80,000 images • Above 14,000 CPU hours on Datastar • Above 12,000 CPU hours on Teragrid • 2d Surface, 3d Topography and volume rendering techniques
One of the Surface Viz • Movie Clip
One of the Volume Viz • Movie Clip
Current Viz Effort • Wave propagation in 3d • Topography with wave propagation • Movie Clip
Tools we use • Vista (SDSC/NPACI) – Batch Volume renderer • Mesh Viewer (SDSC/NPACI) – Interactive Volume Renderer • Alias’s Maya & Image Studio • Adobe’s suite (After Effects, Photoshop, Illustrator) • Other things that work
Does Visualization help? • Diagnosis, monitoring and verification • Identification of fairly simple aggregate behavior of the phenomenon (wavefields) that could not be guessed at by simply examining standard output • Integrate disparate data • Makes the results palatable to broader audience
? - Website to visit http://visservices.sdsc.edu/ Drop a line to amit@sdsc.edu