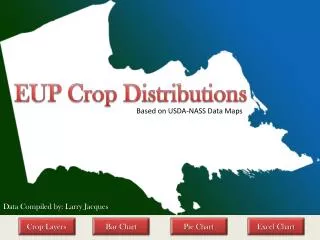
Visualizing Crop Distributions in the EUP Using USDA-NASS Data
This dataset provides a comprehensive analysis of crop distributions across the Eastern Upper Peninsula (EUP), utilizing USDA-NASS data. Compiled by Larry Jacques, it includes detailed maps and various chart formats—such as bar charts, pie charts, and Excel charts—for crops such as corn, soybeans, oats, rye, wheat, barley, and more. Additional land uses like evergreen forests, grasslands, and wetlands are also represented, allowing for a multifaceted view of agricultural and natural distributions in the region.

Visualizing Crop Distributions in the EUP Using USDA-NASS Data
E N D
Presentation Transcript
EUP Crop Distributions Based on USDA-NASS Data Maps Data Compiled by: Larry Jacques Crop Layers Bar Chart Pie Chart Excel Chart
Crop Layers Corn and Soybean Evergreen Forest Grass Land Oats Rye Wheat Barley Pasture / Hay Woody Wetlands Back Barren/Developed Deciduous Forest Fallow/Seed/Clover Herbaceous Wetlands Other Hay / Alfalfa Shrub land