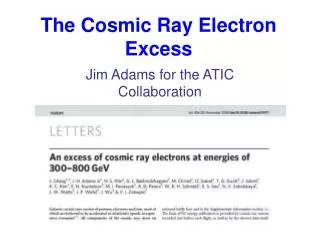
The Cosmic Ray Electron Excess
The Cosmic Ray Electron Excess. Jim Adams for the ATIC Collaboration. Outline. Advanced Thin Ionization Calorimeter (ATIC) Results SNRs and other conventional sources Pamela Results Dark Matter as the source What’s Next Conclusions. ATIC Instrument. Antarctic Flights: 12/28/00 - 1/13/01

The Cosmic Ray Electron Excess
E N D
Presentation Transcript
The Cosmic Ray Electron Excess Jim Adams for the ATIC Collaboration
Outline • Advanced Thin Ionization Calorimeter (ATIC) Results • SNRs and other conventional sources • Pamela Results • Dark Matter as the source • What’s Next • Conclusions
ATIC Instrument • Antarctic Flights: • 12/28/00 - 1/13/01 • 12/29/02 – 1/18-03 • 12/27/07 – 1/15/08
Silicon Matrix • 4 1.5X2 cm2 silicon pads per daughter board • 28 daughter boards per mother board • 2 motherboards per ladder • 10 ladders per panel • 2 panels with 4480 pads total
1.5 r.l. Carbon Target Section • Target: 30 cm graphite interspersed with three scintillating hodoscope layers • Hodoscopes: Bicron BC-408 scintillator strips (1cm X2 cm) read out from both ends with Hamamatsu R5611 PMTs
18 r.l. BGO Calorimeter • 2.5cm X 2.5cm X 25cm bismuth germanate crystals • 20 crystals per half tray, each viewed from one end by a Hamamatsu R5611 PMT • 40 crystals per tray • 8 trays
How are electrons measured? • Silicon matrix identifies charge • Calorimeter measures energy to 2% • Key issue: Separating protons and electrons • Require interactions in the target • 78% of electrons and 53% of protons interact • Energy deposited in the calorimeter helps: • Electrons 85%; Protons 35% Ep = 2.4XEe • Reduces proton flux by X0.23 • Combined reduction is X0.15, then • Examine shower longitudinal profile • Examine shower transverse profile
What are the cuts? • RMS shower width in each BGO layer • Weighted fraction of energy deposited in each BGO layer in the calorimeter
Measured Electron Spectrum AMS (stars) HEAT (triangles) BETS (circles) PPB-BETS (crosses) Emulsions (diamonds) ATIC (red circles)
Cosmic Ray Electron Models • Where do CR electrons come from? • Discrete Sources (~98% at 100 GeV) • Interactions of CR nuclei with interstellar gas • producing +/- or K+/- +/- e+/- (note ’s are fully polarized e+/e- ratio is ~ 2) • How do they move through the Galaxy? • Diffusion [Larmor radius = 2X10⁻⁴ pc/TeV/c] • Energy loss by synchrotron and inverse Compton [so, T = 2.5X105X(1 TeV/E) yr and R = 600X(1 TeV/E)1/2 pc]]
What are the source candidates? • Supernova Remnants • Shock acceleration gives a d/dt E-2exp(-E/Ec) spectrum injected into the ISM, where Ec~ 10 TeV. • Pulsar Wind Nebulae (PWNe) • Electrons released from the stellar surface in the polar caps pair produce in the magnetic fields producing e+/e- pairs • The pairs are accelerated at the PWN termination shock, again giving a d/dt E-2exp(E/Ec) injection • Microquasars • Relativistic jets sending out beams of mono-energetic electrons in to the ISM
The case for Supernova Remnants • Experimental Evidence • Radio synchrotron emission observed • X-ray synchrotron emission observed • TeV gamma ray emission predicted and observed Color-composite image of E0102-72.3: Radio from ATCA; X-ray from Chandra and Visible from HST. HESS image of RX J1713.7-3946
Case for Pulsar Wind Nebulae • PWNe have been observed in x-ray synchrotron and TeV inverse-Compton emissions TeV electron acceleration • Estimated contributions from nearby pulsars are too small (Busching et al. 2008) Combined 90 cm radio image and HESS TeV gamma ray image of SNR G0.9+0.1 (from Aharonian et al., 2005) Predicted positron spectrum from B0656+14. 10% excess in electron spectrum
The case for Micro-quasars • Model of Heinz and Sunyaev (2002) is notional and developed by analogy to SS433’s • They modelled GRS 1915+105 and GRO J1655-40 • Mono-energetic beam • Max energy is 10 GeV • Propagation will spread spectrum toward lower energies like ATIC sees • Energy is too low
Local CR Electron Spectrum from Supernova Remnants • The number of SNRs contributing to the local CR electron flux depends in the Galactic volume sampled and the lifetime of the CR electrons. [i.e. T = 2.5X105x(1 TeV/E) yr and R = 600x(1 TeV/E)1/2 pc] • 10 -100 sources for ATIC electrons Pohl and Esposito (1998) have explored this problem and find a broad range of possible spectra above 30 GeV. • These spectra can be irregular • The electron spectrum should evolve over ~105 years • So what is our spectrum now? Note: this all depends on the choice of diffusion coefficient From Pohl and Esposito (1998)
The electron spectrum Now • Kobayashi et al (2004) have tried to predict the local CR electron spectrum by: • Computing a background spectrum from distance sources • Adding the contributions from the 9 known SNRs that are within 1 kpc and are <4x10⁵ years old. • Note that at if the SN rate in our galaxy is 2/century, we should expect ~36 SNRs in this table! This table is from Kobayashi et al. (2004) Emax = 2.5X10⁵ yr/Age is the max energy after propagating in the ISM for Age years.
So what might be the characteristics of ATIC’s SNR? • To get a peak energy of 0.6 TeV, the SNR must have released the electrons 2.4 Myrs ago • To make such a large contribution to the CR electron flux the SNR would have to be within ~200 pc • The challenge is to find such an old SNR • The Gum Nebula is the right age, but probably too far away H-Alpha image of the Gum Nebula: a 2.6 Myr old SNR located ~400 pc away (Finkbeiner, 2003)
Or maybe its Dark Matter Dashed curve: The electron spectrum predicted by the GALPROP model (Strong and Moskalenko, 2001) Dotted curve: 620 GeV Kaluza-Klein particle directly annihilating to e+/e- pairs and propagated using GALPROP Solid curve: Sum of background electron spectrum and KK annihilation spectrum KK annihilation does fit the excess well but it requires a local clump of dark matter that is ~200 times the average density in the Galaxy
PAMELA Mission The Anti-Matter Exploration and Light-nuclei Astrophysics (PAMELA) satellite was launched on June 15, 2008: * to search for evidence of annihilations of dark matter particles (e.g. non-hadronic particles outside the Standard Model) by precisely measuring antiproton and positron energy spectra; * to search for anti-nuclei, in particular anti-helium; * to test cosmic-ray propagation models through precise measurements of the antiparticle energy spectrum and precision studies of light nuclei and their isotopes. PAMELA also measures the electron and positron spectra.
PAMELA ResultsAdriani et al. (2008) The positron excess exceeds the prediction of Moskalenko and Strong (1998) above 10 GeV (dashed curve) These are difficult experiments. Positrons and protons must be separated
Comparison of PAMELA positron excess with the ATIC, assuming half the electron excess in ATIC is positrons.Open and filled circles are from each of the two ATIC flights.
What is Dark Matter Annihilation? • Dark Matter Types: • Neutralinos: Super-symmetric partners for Z-Bosons, photons and Higgs bosons • Do not annihilate directly into e+/e- pairs produce only low energy electrons • Kaluza-Kline particles: • - Can annihilate directly into e+/e- pairs high energy electrons are produced Positron spectrum model from Cheng (2002): Yellow is the secondary positron background;Other colors are the additions from KK annihilation for the various rest masses shown.
What are Kaluza-Klein Particles • Felix Kaluza and Oscar Kline noticed that if additional spatial dimensions are assumed to exist (very compact ones, too small to be observable) then Einstein’s field equations and Maxwell’s equations could be unified. • This has lead us to the string theory we have today where all of physical theories can be unified by assuming an 11-dimensional spacetime. • Ordinary particles can move in these extra compact spatial dimensions. In this case their momentum in a compact dimension looks like their mass in the three extended dimensions of space a hierarchy of KK particles.
Future Astrophysical Measurements • GLAST LAT: This instrument has the possibility to check the ATIC result if electrons can be separated from protons up to 1 TeV. • AMS: AMS is a magnetic spectrometer like Pamela only bigger and more power full. It is claimed that AMS will measure the positron excess up to 1 TeV. • OASIS: The HEPCAT instrument on OASIS is as large calorimeter that can measure the electron spectrum up to 10 TeV to search for features associated with nearby sources
HEPCaT on OASIS Charge Detector Trigger 1 Trigger 2 Neutron Detector and Calorimeter mounting Plate Calorimeter Neutron Detector
Are there really extra dimensions? The Compact Muon Solenoid (CMS) experiment at the Large Hadron Collider (LHC) could find out. CM could pry open the inconspicuous dimensions just enough to allow particles to move between the normal 3D world and other dimensions. This could be seen by the sudden disappearance of a particle into a hidden dimension.
Conclusions • The ATIC excess is evidence for a nearby cosmic ray electron source • Taken by itself, the ATIC result could be explained by an as-yet-undiscovered nearby source • The ATIC and PAMELA results taken together point to a nearby source of electrons and positrons, possibly from dark matter annihilation
Sources and Acceleration of nuclei Sources: Probably Type II Supernovae • CR energy density 1eV/cm3 • Residence time in the galaxy 2.6x10⁷ yrs • Power required ~2.5X1047 ergs/yr • A Type II Supernova yields ~1053ergs • Almost all of it goes into neutrinos • 1051 ergs in the blast wave • SN rate 2/century 2X1049ergs/yr • Blast wave must convert ~1% of its energy into cosmic rays. • Diffusive Shock Acceleration required
protons He Are All Supernova Cosmic Ray Sources of the Same Type? No. If all sources were the same type, all the elemental spectra above 102 Gev/nuc would have the same shape and they don’t. There must be at least two types. Biermann has suggested that the two types are 8-15 Mʘ stars and Wolf-Rayet stars.
Diffusive Shock Acceleration Jokipii Model Cesarsky Model
New HESS TeV -ray Observations RX J1713 - 394 RX J852.0 - 4622 • Evidence for TeV electron acceleraton
Our Galaxy • Diameter = 30 kpc (1 parsec = 3.26 light years) • Disk thickness = 300 pc • Sun: 2/3 out from the center and a little north of the middle • Interstellar medium: gas, dust & cosmic rays - Density ~ 1atom/cm3 • Energy densities in gas, cosmic rays and magnetic field are all ~1 eV/cm3 • Magnetic field ~ 5 G • At 1.5X10⁹ eV the Larmor radius of a proton is 3X10⁻⁷ pc
Cosmic Ray Confinement Models • Leaky Box Model • Cosmic rays confined to a box with leakage at the boundary. • Within the box, cosmic only interact with interstellar gas • Halo Diffusion Model • Cosmic rays diffuse through magnetic scattering centers in the Galaxy • The densities of scattering centers and gas are highest in the Galactic disk but extend into a halo above and below the disk • Cosmic rays interact with the gas in the Galaxy and escape by diffusion
Cosmic Ray Confinement Re-acceleration due to scattering during diffusion has been added (see Heinbach and Simon, Ap. J. 441, 209(1995)
Diffusion model Leaky Box ATIC-2 Results The ATIC H and He spectra are fit by a diffusion model that includes weak re-acceleration due to Kolmogorov turbulence (Osborne and Ptuskin, 1988) but different source spectra for H and He are required.