Download
1 / 10
110 likes | 268 Vues
Trends in the Chandra X-Ray Spectra of O and Early B Stars. June 24, 2008. Spectra of Stars. We know that spectra result from physical processes within stars. They often reflect physical properties of the stars that created them. ex. Optical Spectra. X-Ray Spectra of O and Early B Stars.

E N D
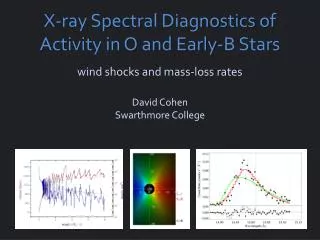
Trends in the Chandra X-Ray Spectra of O and Early B Stars June 24, 2008
Spectra of Stars • We know that spectra result from physical processes within stars. • They often reflect physical properties of the stars that created them. ex. Optical Spectra
X-Ray Spectra of O and Early B Stars • The spectra on the left are a representative sampling of O and early B star spectra, with earlier spectral types at top. • The spectra were taken on the Chandra X-Ray telescope using the high energy transmission grating (HETG) on the advanced camera for imaging spectroscopy (ACIS). • Nolan Walborn suggested in a 2006 paper that these spectra may reveal a temperature trend similar to that observed for optical spectra. • I will be looking for evidence that tends to confirm or disprove this hypothesis.
X-Ray Production in Hot Stars • X-Ray emission arises in the stellar winds of these stars. • The stellar winds are radiatively driven. • The line-driven stellar winds are inherently unstable. • Shocks in the wind arise from the instability and produce x-rays.
X-Ray Spectra and Temperature • Line strength ratios • Differential Emission Measure dEM= nenH dV In a plasma with a single well-defined temperature, or D(T)= ne(T)nH(T)(dV/d logT) in a plasma with a temperature distribution.
Delta Orionis O9.5 II + B0.5 III Teff = 33000 K R= 17 Rsun M=23 Msun vinf = 2000 km/s dM/dt = 1.07 * 10-6 Msun/yr HD93129AB O2 If* + (2x) O3.5 V((f+)) Teff = 50000 K R= 20 Rsun M=120 Msun vinf = 3200 km/s dM/dt = 1.8 * 10-5 Msun/yr Xi Persei O7.5 III(n)((f)) Teff = 36000 K R= 12 Rsun M=34 Msun vinf = 2450 km/s dM/dt = 2.0 * 10-6 Msun/yr Stars and Parameters
HD93129AB Xi Persei Delta Orionis 0.05 ± 0.02 0.05 ± 0.02 0.21 ± 0.06 Silicon XIV/Silicon XIII Ratios
HD93129AB Xi Persei Delta Orionis 0.27 ± 0.04 0.12 ± 0.02 0.24 ± 0.03 Magnesium XIV/Magnesium XIII Ratios
Conclusions (for now) • Line ratios of stars in our sample seem to have little to do with effective temperature. • This tends to disprove Walborn’s suggestion that the trend in the spectrum is temperature-related. • However, there does appear to be some slight tendency for individual lines to become broader and more blueshifted in the hotter stars.
Some Directions for Research • Continue to measure line ratios in more stars. • Possibly explore measuring line ratios for other elements. • Look into measuring emission measures for our sample stars as another probe of temperature.