Download
1 / 8
80 likes | 163 Vues
Explore the performance of Sydney residential property and Australian shares with cumulative percentage movements. This presentation by Bridges Financial Services Pty Limited provides general advice prepared by ASX Participant, AFSL No.240837.

E N D
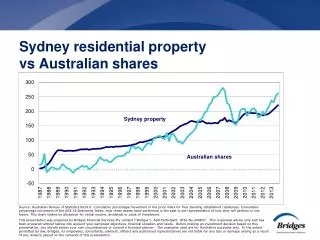
Sydney residential property vs Australian shares Sydney property Australian shares Source: Australian Bureau of Statistics 6416.0. Cumulative percentage movement in the price index for free standing established residences. Cumulative percentage movement of the ASX All Ordinaries Index. How these assets have performed in the past is not representative of how they will perform in the future. This chart makes no allowance for rental income, dividends or costs of investment. This presentation was prepared by Bridges Financial Services Pty Limited (“Bridges”). ASX Participant. AFSL No.240837. This is general advice only and has been prepared without taking into account your particular objectives, financial situation and needs. Before making an investment decision based on this presentation, you should assess your own circumstances or consult a financial planner. The examples used are for illustrative purposes only. To the extent permitted by law, Bridges, its employees, consultants, advisers, officers and authorised representatives are not liable for any loss or damage arising as a result of any reliance placed on the contents of this presentation.
Melbourne residential property vs Australian shares Australian shares Sydney property Australian shares Melbourne property Source: Australian Bureau of Statistics 6416.0. Cumulative percentage movement in the price index for free standing established residences. Cumulative percentage movement of the ASX All Ordinaries Index. How these assets have performed in the past is not representative of how they will perform in the future. This chart makes no allowance for rental income, dividends or costs of investment. This presentation was prepared by Bridges Financial Services Pty Limited (“Bridges”). ASX Participant. AFSL No.240837. This is general advice only and has been prepared without taking into account your particular objectives, financial situation and needs. Before making an investment decision based on this presentation, you should assess your own circumstances or consult a financial planner. The examples used are for illustrative purposes only. To the extent permitted by law, Bridges, its employees, consultants, advisers, officers and authorised representatives are not liable for any loss or damage arising as a result of any reliance placed on the contents of this presentation.
Perth residential property vs Australian shares Australian shares Perth property Source: Australian Bureau of Statistics 6416.0. Cumulative percentage movement in the price index for free standing established residences. Cumulative percentage movement of the ASX All Ordinaries Index. How these assets have performed in the past is not representative of how they will perform in the future. This chart makes no allowance for rental income, dividends or costs of investment. This presentation was prepared by Bridges Financial Services Pty Limited (“Bridges”). ASX Participant. AFSL No.240837. This is general advice only and has been prepared without taking into account your particular objectives, financial situation and needs. Before making an investment decision based on this presentation, you should assess your own circumstances or consult a financial planner. The examples used are for illustrative purposes only. To the extent permitted by law, Bridges, its employees, consultants, advisers, officers and authorised representatives are not liable for any loss or damage arising as a result of any reliance placed on the contents of this presentation.
Brisbane residential property vs Australian shares Brisbane property Sydney property Australian shares Australian shares Source: Australian Bureau of Statistics 6416.0. Cumulative percentage movement in the price index for free standing established residences. Cumulative percentage movement of the ASX All Ordinaries Index. How these assets have performed in the past is not representative of how they will perform in the future. This chart makes no allowance for rental income, dividends or costs of investment. This presentation was prepared by Bridges Financial Services Pty Limited (“Bridges”). ASX Participant. AFSL No.240837. This is general advice only and has been prepared without taking into account your particular objectives, financial situation and needs. Before making an investment decision based on this presentation, you should assess your own circumstances or consult a financial planner. The examples used are for illustrative purposes only. To the extent permitted by law, Bridges, its employees, consultants, advisers, officers and authorised representatives are not liable for any loss or damage arising as a result of any reliance placed on the contents of this presentation.
Hobart residential property vs Australian shares Australian shares Hobart property Source: Australian Bureau of Statistics 6416.0. Cumulative percentage movement in the price index for free standing established residences. Cumulative percentage movement of the ASX All Ordinaries Index. How these assets have performed in the past is not representative of how they will perform in the future. This chart makes no allowance for rental income, dividends or costs of investment. This presentation was prepared by Bridges Financial Services Pty Limited (“Bridges”). ASX Participant. AFSL No.240837. This is general advice only and has been prepared without taking into account your particular objectives, financial situation and needs. Before making an investment decision based on this presentation, you should assess your own circumstances or consult a financial planner. The examples used are for illustrative purposes only. To the extent permitted by law, Bridges, its employees, consultants, advisers, officers and authorised representatives are not liable for any loss or damage arising as a result of any reliance placed on the contents of this presentation.
Adelaide residential property vs Australian shares Australian shares Adelaide property Source: Australian Bureau of Statistics 6416.0. Cumulative percentage movement in the price index for free standing established residences. Cumulative percentage movement of the ASX All Ordinaries Index. How these assets have performed in the past is not representative of how they will perform in the future. This chart makes no allowance for rental income, dividends or costs of investment. This presentation was prepared by Bridges Financial Services Pty Limited (“Bridges”). ASX Participant. AFSL No.240837. This is general advice only and has been prepared without taking into account your particular objectives, financial situation and needs. Before making an investment decision based on this presentation, you should assess your own circumstances or consult a financial planner. The examples used are for illustrative purposes only. To the extent permitted by law, Bridges, its employees, consultants, advisers, officers and authorised representatives are not liable for any loss or damage arising as a result of any reliance placed on the contents of this presentation.
Darwin residential property vs Australian shares Australian shares Darwin property Source: Australian Bureau of Statistics 6416.0. Cumulative percentage movement in the price index for free standing established residences. Cumulative percentage movement of the ASX All Ordinaries Index. How these assets have performed in the past is not representative of how they will perform in the future. This chart makes no allowance for rental income, dividends or costs of investment. This presentation was prepared by Bridges Financial Services Pty Limited (“Bridges”). ASX Participant. AFSL No.240837. This is general advice only and has been prepared without taking into account your particular objectives, financial situation and needs. Before making an investment decision based on this presentation, you should assess your own circumstances or consult a financial planner. The examples used are for illustrative purposes only. To the extent permitted by law, Bridges, its employees, consultants, advisers, officers and authorised representatives are not liable for any loss or damage arising as a result of any reliance placed on the contents of this presentation.
Canberra residential property vs Australian shares Australian shares Canberra property Source: Australian Bureau of Statistics 6416.0. Cumulative percentage movement in the price index for free standing established residences. Cumulative percentage movement of the ASX All Ordinaries Index. How these assets have performed in the past is not representative of how they will perform in the future. This chart makes no allowance for rental income, dividends or costs of investment. This presentation was prepared by Bridges Financial Services Pty Limited (“Bridges”). ASX Participant. AFSL No.240837. This is general advice only and has been prepared without taking into account your particular objectives, financial situation and needs. Before making an investment decision based on this presentation, you should assess your own circumstances or consult a financial planner. The examples used are for illustrative purposes only. To the extent permitted by law, Bridges, its employees, consultants, advisers, officers and authorised representatives are not liable for any loss or damage arising as a result of any reliance placed on the contents of this presentation.