Download
1 / 20
200 likes | 333 Vues
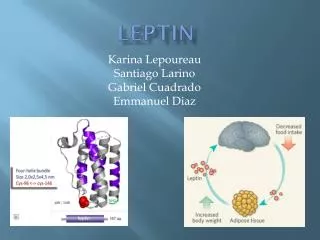
The Relationship of Leptin and Stress Among Worksite Employees. Rachel M. Ceballos April 20, 2007. I. Background: Leptin. Hormone Released : adipocytes, ovaries, mammary glands Receptors Distributed: throughout the body (central/peripheral) Function:

E N D
The Relationship of Leptin and Stress Among Worksite Employees Rachel M. Ceballos April 20, 2007
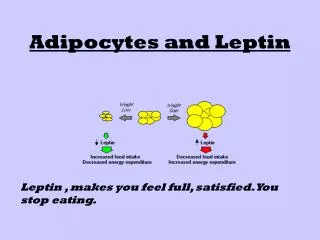
I. Background: Leptin • Hormone • Released: adipocytes, ovaries, mammary glands • Receptors • Distributed: throughout the body (central/peripheral) • Function: • Leptin can contribute to the regulation of… -Metabolism -Puberty -Hematopoiesis -Immune Function -Stress Systems
I. Background: Leptin & Stress • What is the relevance to cancer prevention and control? - - Immune Function Stress Cancer (e.g. TH1) - + Leptin
I. Background: Leptin and Stress Animal Model • Lower leptin levels • Wistar Male and Sprague-Dawley Male and Female rats • Immobilization Stress: 3 hrs/day for 3-10 days or 20 min/day for 21 days (Harris et al., 2002; Makino et al., 1999: Gomez, Houshyar, & Dallman, 2002;Ceballos et al, 2006) • Higher leptin levels • Long Evans Male and Female rats • Immobilization Stress: 20 min/day for 21 days (Ceballos, Faraday & Klein, 2006)
I. Background: Leptin and Stress • Human Model • Lower leptin levels • Female medical students • Post-menopausal women exposed to acute laboratory stressor • Healthy adults following physical activity (Al-Ayadhi, et al, 2005; Ceballos,et al, in preparation;Legakis et al, 2004) • No difference • Healthy men and pre-menopausal women exposed to acute laboratory stressor (Ceballos, et al, in preparation) • High Leptin Levels • Male Japanese government employees (Otsuka, et al, 2006)
I. Background: Purpose Pilot Study to examine the relationship between leptin and stress in a community based sample
II. Methods • Randomized Trial: Promoting Activity and Changes In Eating, PACE (Beresford, S.A.A., P.I.) • 30 Worksites in the Seattle area • Worksites with 40 and 350 employees • Pair-matched on several characteristics (e.g., size, % women, • baseline response rate) • Worksites randomly assigned to intervention or comparison (delayed intervention) arm • Subgroup of individuals asked to provide blood sample and complete additional questionnaires
II. Methods • Participants • 10 worksites • N=80 • 33 Men, 47 Women • Mean Age: 41.62 (11.13) • Education: % Some high School 1.10 High School Graduate/GED 9.89 Technical/Business School 17.58 Some college 23.08 College graduate 36.26 Post graduate/professional 12.09 • Randomly selected half of the individuals from the PACE intensive subgroup
II. Methods • Assessment • Baseline assessment • 10-Item Perceived Stress Scale • Cohen, Kamarck, & Mermelstein,1983 • “in the last week” • Serum leptin (ng/mL) • UW Northwest Lipid Research Laboratory • Radioimmunoassay (RIA)
II. Methods Analysis • Mixed Analysis • Continuous • Categorical • Independent Variable: 4 categories of stress • Dependent Variable: Serum Leptin • Leptin data log transformed • Covariates: • Worksite (random) • Gender and Body Mass Index (fixed)
III. Results Descriptives:
III. Results • Stress entered as continuous predictor variable F-value (df)p-value Perceived Stress 0.14 (1,71) 0.71 Gender 50.09 (1,71) 0.001 Body Mass Index 118.10 (1,71) 0.001
III. Results • Stress entered as categorical variable Quartile Scores: Low (1-6) Moderate (11-15) Low Moderate (7-10) High (16-29) F-value (df) p-value • Perceived Stress 0.37 (3,69) 0.78 • Gender 48.93 (1,69) 0.001 • BMI 117.95 (1,69) 0.001
III. Results • Stress entered as categorical variable (cont.) t-value (df)p-value Quartile 1- Quartile 2 0.35 (69) 0.73 Quartile 1- Quartile 3 0.76 (69) 0.45 Quartile 1- Quartile 4 0.95 (69) 0.34 Quartile 2- Quartile 3 0.48 (69) 0.64 Quartile 2- Quartile 4 0.68 (69) 0.50 Quartile 3- Quartile 4 0.17 (69) 0.86
III. Results • Effect of Gender
III. Results • Stress entered as continuous predictor variable • F-value (df)p-value • Perceived Stress 0.00 (1,70) 0.949 • Gender 22.55 (1,70) 0.001 • Perceived Stress*Gender 1.85 (1,70) 0.178 • Body Mass Index 122.07 (1,70) 0.001
IV. Conclusion • No significant relationship between leptin and stress • Preliminary analyses conducted to determine appropriate sample size • Range of stress scores comparable to other studies • Menstrual cycle, use of medication, diet, etc. were not controlled
IV. Conclusion • Changes in leptin may only be evident following acute stress • Higher levels of stress may be required to see a change in leptin levels • Action of chronic stress on immune function may not be mediated by leptin • leptin may not contribute to changes in the microenvironment of tumor cells
IV. Future Directions • May want to consider • Stress type and duration • Dietary intake • CARB Study, Glycemic Load and Obesity Effects on Cancer Biomarkers (Neuhouser, M., Lampe, J.W., PI) • Health SMART, Stress Management and Relaxation Training (McGregor, B.A., PI) • Conduct additional analyses on PACE data
Acknowledgements • Shirley Beresford, Ph.D. • Dale McLerran • Sonia Bishop • Bonnie McGregor, Ph.D.