Download

1 / 50
500 likes | 613 Vues
Diversified vs. Specialized Swine and Grain Enterprises in Iowa. Laura Borts, Gary May, and John Lawrence Iowa State University. Background and Justification. Iowa 1980 – 2001 Number of farms -22% Average acres per farm +23% Hog producing farms 1980 over 53% of farms

E N D
Diversified vs. Specialized Swine and Grain Enterprises in Iowa Laura Borts, Gary May, and John Lawrence Iowa State University
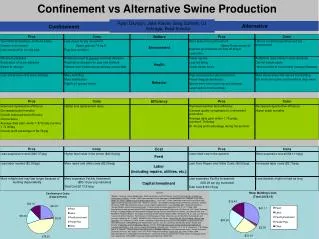
Background and Justification • Iowa 1980 – 2001 • Number of farms -22% • Average acres per farm +23% • Hog producing farms • 1980 over 53% of farms • 2002 only 11% of farms
Research Questions The research committee from the Iowa Pork Producers Association approach ISU with the following questions • Is there still a role for traditional diversified crop-hog farms? • Is the trend toward specialization likely to continue? • Role of public policy
Previous Studies • Purdy, B.M., M.R. Langemeier, and A.M. Featherstone. 1997. Financial Performance, Risk, and Specialization. Journal of Agricultural and Applied Economics, 29,1(July 1997): 149-161 • Grain operations that diversified into beef cattle production reduced mean return on investment as well as the variability in return on investment. • Diversification into swine and dairy production increased mean income and decreased variability.
What Other Studies Have Said • Advantages of Diversification • Complementary characteristics • Byproduct of one enterprise serves as an input for another • Matching feed requirements with feed supply • More efficient distribution of labor and risk • Advantages of Specialization • Farm resources may offer an advantage to a specific enterprise • Productivity improvement from specialized skills • Volume discounts on larger purchases • How to have both????
The Model • Whole Farm Budget Comparison • Cash grain v. diversified grain-hog farm • Farrow to finish • Breed to wean • Wean to finish • Measures of profitability • Return to labor, management, and owned assets. • Rate of return on investment
Model Assumptions • 6,000 hours of labor per year • No seasonal labor constraint • Corn production = corn demand • Corn acres = soybean acres • Manure applied ahead of corn • Tractors shared between crop and hogs
Cash Grain v. Hog-Grain Farms With 6,000 Hours of Labor per Year Enterprise Acres Sows Hogs Sold Cash Grain 2,400 Farrow-Finish w/G 550 191 3,270 Breed - Wean w/G 229 616 12,200 Wean - Finish w/G 723 5,963
Data Sources • Budget coefficients were derived from Iowa State University livestock and crop enterprise budgets • Crop and livestock prices were derived from USDA-AMS
Stochastic Component of the Model • A simple budget comparison represents a single point in time. • How does enterprise diversification impact income variability? • How frequently is one combination of enterprises more profitable than another? • Monte Carlo simulation is a common method of addressing these issues
Role of 2002 Farm Bill • Compared models that included and excluded farm program payments • Specific programs we modeled • Loan deficiency payments • Counter cyclical payments • Direct payments
Net Return to Labor and Management Excluding Government Payments ($/yr)
Net Return to Labor and Management Including Government Payments ($/yr)
Percent of Observations by Rank and that Beat Cash Grain Government Payments Included
Research Questions Revisited • Is there still a role for traditional diversified crop-hog farms? • Conclusion: Yes, there appears to be an acceptable return to labor for producers who wish to operate a diversified crop/livestock farm. • Is the trend toward specialization likely to continue? • Conclusion: Not directly addressed in this study. • Our model suggests farm subsidies have trumped the income stabilization benefits of diversification.
Summary • Cost savings from diversification • Less acres per person with livestock • Impact of 2002 Farm Bill • Without: cash grain was lowest average and highest risk • With: cash grain is highest average and lowest risk
Pulling It All Together: Managing Cattle and Crops through Feed and Fertilizer John Lawrence, Iowa Beef Center at ISU Evan Vermeer, Iowa Cattlemens Association
Commercial Supplement DGS Diet Formation Crop Sold Cattle Bought $ Management Cattle Crops Rules & Regulations Information & Records Advice & Service Cattle Sold Commercial Fertilizer Manure Export Manure Application
Guiding Principles • What goes in comes out • Everything has a cost or value • Nutrients only have value if they are needed (applies to feed or fertilizer) • Influence outputs through inputs
Value of Applied Manure Supply and Crop Demand Nutrients have value where they are needed
300 Head Feedlot ExampleNutrient Supply, Value * 26#/A available 2nd year
Feedlot Example C-C Crop Demand, Value Cannot apply at low rates so use 3 year rotation
Farm C-1 C-2 C-3 C-4 Facility 2,200 hd 4,000 hd 4,000 hd 3,300 hd Cropland 160 ac 446 ac 452 ac 173 ac Inputs 109,000 211,000 185,000 105,000 Outputs 67,000 158,000 115,000 69,000 Imbalance 68,000 53,000 69,000 35,000 In/Out Ratio 1.6 to 1 1.3 to 1 1.6 to 1 1.5 to 1 Iowa Farms - Nitrogen
Farm C-1 C-2 C-3 C-4 Facility 2,200 hd 4,000 hd 4,000 hd 3,300 hd Cropland 160 ac 446 ac 452 ac 173 ac Inputs 16,000 29,000 28,000 16,000 Outputs 14,000 28,000 21,000 14,000 Imbalance 3,000 0 7,000 2,000 In/Out Ratio 1.1 to 1 1.0 to 1 1.3 to 1 1.1 to 1 Iowa Farms - Phosphorus
Historic Perspective Pork Nitrogen Corn Milk P2O5 Eggs Soybeans K2O Beef
Future Perspective ? Pork Nitrogen Corn P2O5 Milk ? Soybeans K2O ? Eggs ? Beef ? Ethanol DGS
At Plant 30 Miles 60 Miles 100 Miles Profit Advantage Assume: 95% of corn price, $0.10/bushel increase corn price, costs covered, 153 days
At Plant 30 Miles 60 Miles 100 Miles Optimum Use Assume: 75% of corn price, $0.10/bushel increase corn price, costs covered, 153 days (Calculated from 2006 U. of Nebraska Analysis) Source: Dan Loy, ISU
Figure 2. Dietary P in Beef Feedlot Diets 0.7 Future (?) 0.6 0.50% P 0.5 0.40% P % diet P (DM-basis) 0.4 Excreted by animal 0.27% P 0.3 Animal P Requirement 0.2 0.1 Retained by animal 0 85% corn, 0% DGS 40% DGS 75% DGS & CGF 20% DGS Inclusion rate of DGS and CGF in diet
Impact of DGS Inclusion on Nutrient Management • Great N and P excretion • Greater land requirements. • Greater travel distances and time requirements impacting labor, capital and operating costs. • Book values of nutrient concentration will not be representative.
Annual net value of manure, spreading cost and total fertilizer value of manure ($1,000 per year) for a 20,000 head beef open lot under corn-soybean rotation.
Paradigm Shift • Do crop farmers buy and apply P2O5? • How much do they pay for it? • Do livestock producers have enough land for P-Index based applications? • What is the value of excess P2O5? • Is there an opportunity for these two people? • What are possible outcomes? • Win-win: Feedlot sells P2O5 at reduced rate • Win-draw: Feedlot sells at full price or gives away • Lose-lose-lose: Cropper imports, Feedlot wastes, and P levels continue to accumulate in Iowa soils or Iowa exports value added potential
Natural, Organic, and Grass-fed Beef Production: Economics and Transition • Nicolas Acevedo, Margaret Smith, and John D. Lawrence • Funded by Leopold Center for Sustainable Ag • http://www.iowabeefcenter.org/content/Organic_Natural_Grass_Fed_Beef_2006.pdf
Scenarios • Cow-calf to slaughter operation • Spring born calves • November 1 weaning date • Five production systems • Three grain-fed systems • Conventional, natural, organic • Two grass-fed systems • Natural, organic • Conventional and CRP conversions
Scenarios • Three grain-fed systems • Medium frame cattle • 475# weaned calf • 1250# slaughter weight • Conventional slaughter 1400# with implants • Two grass-fed systems • Small frame cattle • 425# weaned calf • 1030# slaughter weight • 18% lower cow feed cost
Production Model • Seasonally available forage • MIG in all systems • Animal growth based on the Cornell Net Carbohydrate and Protein System (CNCPS)
Long-run Feed and Cattle Prices and Organic Premiums Used in Analysis
Estimated Prices, Costs and Returns by System* * Prices and costs are in $/lb carcass weight
Profitability Summary • Inputs are priced at opportunity cost • Organic prices and costs near breakeven • Natural grass-fed premium not high enough for cost • Grass-fed cost of wintering weaned calf is a challenge
Cash Flow Analysis • 100 cow conventional herd • Five systems modeled • Stay conventional • Convert to organic grain or grass over a 3 year period • Convert to organic grain or grass more quickly using CRP land • Sell natural while transitioning