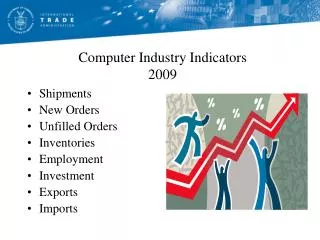
Computer Industry Indicators 2009
The U.S. computer hardware industry faced significant challenges from 2007 to 2009, as evidenced by a 6.5% drop in shipments to $63.6 billion in 2009. New orders also declined by 8%, and unfilled orders saw only a slight drop. Employment in the industry fell sharply by 9.4%, reflecting ongoing cost-cutting measures by companies. With sluggish demand affecting both exports and imports, this analysis highlights the industry's struggle against the backdrop of a weak global economy and changing consumer behaviors during this period.

Computer Industry Indicators 2009
E N D
Presentation Transcript
Computer Industry Indicators2009 • Shipments • New Orders • Unfilled Orders • Inventories • Employment • Investment • Exports • Imports
Computer Hardware Industry Trends2007-2009 $ Billions Source: Census Bureau, M3 Group: CRP: Computers and Related Products
Computer Hardware Industry Trends • U.S.-based computer industry shipments dropped 6.5 percent from $68 billion in 2008 to $63.6 billion in 2009. With the continued weakness in the global economy, customers cutback spending for computers and related products. • The value of new orders fell 8 percent, while unfilled orders dropped 1 percent when compared with 2008. Inventories declined 13 percent in 2009 as companies worked to minimize inventories in a sluggish market.
Industry Shipmentsby Category $ Billions • Computer systems production declined 7 percent to $44.4 billion in 2009 following a 7 increase in 2008. Demand for computer equipment was postponed in both the business and consumer segments. • Storage equipment shipments fell 11 percent, while peripheral equipment shipments dipped 2 percent below the 2008 levels. Source: Census Bureau, M3
Computers and Related ProductsNew Orders/Unfilled OrdersDefinitions • New orders are orders received and filled during the reporting period and orders received for future delivery. • Unfilled orders are equal to unfilled orders at the beginning of the period plus net new orders received less shipments. This includes orders that have not yet passed through the sales account and been reported as sales.
Computers and Related ProductsNew Orders/Unfilled Orders $Billions • New orders declined 8 percent or by $5.8 billion to $63.5 billion in 2009 when compared to 2008. • Meanwhile, unfilled orders dipped 1 percent to $55.2 billion in 2009. Source: Census, M3
Computer Industry Indicators Inventories2007-2009 $ Billions Source: Census, M3
Computer Industry IndicatorsTotal Employment2002-2009 Thousands of Workers Source: Bureau of Labor Statistics
Computer Industry IndicatorsTotal Employment/Production Workers • Employment continued its downward trend dropping another 9.4 percent, or 17 thousand workers in 2009. • Production workers fell 5 percent from 122.1 thousand to 116 thousand reflecting companies’ continuing efforts to contain cost. • The continuation of job cuts can be attributed to a number of factors including company downsizing, industry consolidation, and downturns in the global economy. Thousands Source: Bureau of Labor Statistics
Computer Industry Indicators Business Investment and Consumer Spending* Computers and Peripheral Equipment $ Billions • Source: Bureau of Economic Analysis • Personal consumption expenditures reclassified as personal computers and peripheral equipment to better reflect the activity of the industry.
Computer Industry IndicatorsU.S. Trade: 2007-2009 $ Billions Source: U.S. Department of Commerce
U.S. Computer Trade2008-2009 • Computer product exports tumbled 25 percent to $20.1 billion in 2009, following a 4 percent drop in 2008. Demand remains sluggish in most export markets. • The slowdown in worldwide economic activity continues to take a toll on demand for computer products. • Imports dropped 6 percent to $90.1 billion during 2009, signaling the slow turnaround in U.S. demand for computer products. • China, the primary supplier, sent $49.5 billion in computer products during 2009, but the value declined 3 percent when compared to 2008. China accounted for 55 percent of the U.S. computer product import total.
U.S. Computer Exports by Region2009 Source: U.S. Department of Commerce, Census Bureau
U.S. Computer Imports by Region2009 $ Millions Source: U.S. Department of Commerce, Census Bureau
Exports –2009 ($ Millions) Canada 2,426 Mexico 2,284 Netherlands 1,283 China 1,029 United Kingdom 984 Imports –2009 ($ Millions) China 49,466 Malaysia 8,173 Mexico 7,691 Japan 5,445 Thailand 3,326 Top Five Destinations – U.S. Computer ExportsTop Five Suppliers – U.S. Computer Imports Source: U.S. Department of Commerce
Exports – 2009 (Percent) Canada - 27.1 Mexico - 35.5 Netherlands - 25.8 China - 21.3 United Kingdom - 28.3 Imports – 2009 (Percent) China - 2.6 Malaysia - 28.3 Mexico + 23.3 Japan - 10.3 Thailand - 16.1 U.S. Computer TradeGrowth Rates/Declines– Top Five Countries Source: U.S. Department of Commerce