Market Analysis Report: XXX Market Insights & Trends
900 likes | 1.04k Vues
A comprehensive analysis of the XXX market, providing key market engineering measurements, competitor insights, and industry advancements. Stay informed on market trends and forecasts.

Market Analysis Report: XXX Market Insights & Trends
E N D
Presentation Transcript
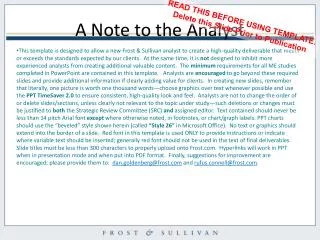
A Note to the Analyst READ THIS BEFORE USING TEMPLATE. Delete this Slide Prior to Publication • This template is designed to allow a new Frost & Sullivan analyst to create a high-quality deliverable that meets or exceeds the standards expected by our clients. At the same time, it is not designed to inhibit more experienced analysts from creating additional valuable content. The minimum requirements for all ME studies completed in PowerPoint are contained in this template. Analysts are encouraged to go beyond these required slides and provide additional information if clearly adding value for clients. In creating new slides, remember that literally, one picture is worth one thousand words—choose graphics over text whenever possible and use the PPT TimeSaver 2.0 to ensure consistent, high-quality look and feel. Analysts are not to change the order of or delete slides/sections, unless clearly not relevant to the topic under study—such deletions or changes must be justified to both the Strategic Review Committee (SRC) and assigned editor. Text contained should never be less than 14 pitch Arial font except where otherwise noted, in footnotes, or chart/graph labels. PPT charts should use the “beveled” style shown herein (called “Style 26” in Microsoft Office). No text or graphics should extend into the border of a slide. Red font in this template is used ONLY to provide instructions or indicate where variable text should be inserted; generally red font should not be used in the text of final deliverables. Slide titles must be less than 300 characters to properly upload onto Frost.com. Hyperlinks will work in PPT when in presentation mode and when put into PDF format. Finally, suggestions for improvement are encouraged; please provide them to: dan.goldenberg@frost.com and rufus.connell@frost.com.
Analysis of the XXX Market evocative subtitle, as per note Region or Global 0000-00 Month 2011
Research Team Lead Analyst Contributing Analyst • Name • Job Title • Department • (International code) Phone number • ****@frost.com • Name • Job Title • Department • (International code) Phone number • ****@frost.com Strategic Review Committee Leader Research Director • Name • Job Title • Department • (International code) Phone number • ****@frost.com • Name • Job Title • Department • (International code) Phone number • ****@frost.com
Executive Summary • This is the money page; give clients “the answers” here • If client only has two minutes to read, this slide will convey all “need to know” information • No more than two slides • No discussion of methodology or long explanation of data/calculations is appropriate here (though you can link to longer explanations contained elsewhere in the document) • No bullets longer than two lines • No text less than 16-pitch font Source: Frost & Sullivan analysis.
This slide will be repeated in the Forecasts section; it is included in the Executive Summary because it is typically one of our most popular slides and gives the “Bottom Line Up-Front” (BLUF). If you need new icons for additional metrics your BU will add, contact Dan Goldenberg. Executive Summary—Market Engineering Measurements Market Overview Total Market Name: Region, Period • Decreasing • Stable • Increasing • Market Stage • Market Revenues • Market Units/Volume • Average Price Per Unit Market Size at End of Forecast Period • $833.3 M • Mature • 2.3 M • $362 • $1.15 B (Base Year) (Base Year) (Base Year) Market Concentration • Base Year Market Growth Rate • X-year Forecast Market Growth Rate • Customer Price Sensitivity • Degree of Technical Change • (7.9%) • 4.8% • 9 • 5 • 53% (% of market share held by top 3 companies) (CAGR) (scale:1 [Low] to 10 [High]) (scale:1 [Low] to 10 [High]) For a tabular version click here. Note: All figures are rounded. The base year is xxxx. Source: Frost & Sullivan analysis.
Executive Summary—Market Engineering Measurements (continued) Competitor Overview Total Addressable Market • Decreasing • Stable • Increasing • Number of Competitors • Number of Companies that Exited* • Number of Companies that Entered* • Replacement Rate • Attachment Rate • 3.2Years • 3.1 • 53 • 8 • 0 (active market competitors in base year) (Base Year) (Base Year) (average period of unit replacement) (current number of units per user – base year) Total Addressable Market Industry Advancement • Marketing Spend as a Percent of Market Revenue • Maximum Attachment Rate Current Potential Users • Average R&D Spend by Product • Average Product Development Time • 2.3% • 7 • $4.7 M • 2.3 • Years • 1.4 M (maximum potential number of units per user) (state formula) • Companies with revenue of more than $50 M revenue. Note: All figures are rounded. The base year is xxxx. • Source: Frost & Sullivan analysis.
Market Overview—Definitions • Description of market • Definitions of regions covered (include color-coded maps) • Definition of unit • Definition of prices • Definition of revenues • Manufacturer’s revenues? Channel revenues? • Definition of terms and acronyms used Source: Frost & Sullivan analysis.
Market Overview—Segmentation Note: All figures are rounded. The base year is xxxx. Source: Frost & Sullivan analysis.
TVSS Manufacturers VARs Consumer Electronics Stores Manufacturer Representatives IT and Electrical Distributors Direct Sales Superstores End User This slide is only for industries with multiple distribution channels. Try to associate some percentage of product volume through each channel. Market Overview—Distribution Channels Key Takeaway: VARs are dominant with increasing influence on product design Total Transient Voltage Surge Suppression Market: Distribution Channel Analysis Region, Year 47.0% 21.0% 32.0% Key: OEMs: original equipment manufacturers; VARs: value-added resellers Source: Frost & Sullivan analysis.
Market Drivers Driver Title Driver Description Driver Title Driver Description
Market Challenges Challenge Title Challenge Description Challenge Title Challenge Description
This series of slides is a tabular repeat of the “dashboard” provided in the executive summary. These slides should have exactly the same data, just displayed in a tabular format, which some clients may prefer. Market Engineering Measurements Market Overview Total Market Name: Region, Base Year Note: All figures are rounded. The base year is xxxx. Source: Frost & Sullivan analysis.
Market Engineering Measurements (continued) Competitor Overview Total Addressable Market * Companies with more than $50 M revenue. Note: All figures are rounded. The base year is xxxx. Source: Frost & Sullivan analysis.
Market Engineering Measurements (continued) Industry Advancement Note: All figures are rounded. The base year is xxxx. Source: Frost & Sullivan analysis.
Forecast Assumptions • Provide detailed bullet points about assumptions (remember, 14-pitch font minimum) that underlie the forecast. To earn credibility for your forecast with clients, you need to explain how you came up with your numbers. Your IRG will define points that should always be included; some factors to consider include: • Impact of GDP • Macroeconomic trends • Imports • Regulatory factors • Commodity prices Source: Frost & Sullivan analysis.
Total XXX Market Unit Shipment and Revenue Forecast This slide can be altered to accommodate comparable metrics for service industries. Key Takeaway: Revenue growth is fueled by new subscribers from 2009 to 2011 Note: All figures are rounded. The base year is xxxx. Source: Frost & Sullivan analysis.
Unit Shipment and Revenue Forecast Discussion • What interesting trend is happening in the forecast period? • Any KEY facts from the three previous years? Be careful here: do not rehash history that is evident on the chart, keep this part brief—readers want insight about the future, which is generally why they read ME studies • Is your five-year forecast trend line smooth? If peaks or valleys exist in your forecast, explain what they mean and why they occur. • Explicitly state methodology, probabilities and variables underlying the forecast in a footnote • Discuss top drivers and restraints impacting the forecast • Feel free to use multiple slides (using no less than 14-pitch font) Source: Frost & Sullivan analysis.
Total XXX Market Pricing Trends and Forecast Key Takeaway: After three years of stagnation, prices are expected to climb at a x% CAGR for the next five years Note: All figures are rounded. The base year is xxxx. Source: Frost & Sullivan analysis.
Pricing Trends and Forecast Discussion • Describe factors influencing price (some possibilities are listed below) : • Customer knowledge gap between low-end and high-end products. • Private labeling • Intense competition due to low-cost competitors • Emergence of substitute products • Product commoditization • Lack of product differentiation • Input commodity prices Source: Frost & Sullivan analysis.
Pricing Trends and Forecast Discussion (continued) • What interesting trend is happening in the forecast period? • Any KEY facts from the three previous years? Be careful here: do not rehash history that is evident on the chart, keep this part brief—readers want insight about the future, which is generally why they read ME studies • Is your five-year forecast trend line smooth? If peaks or valleys exist in your forecast, explain what they mean and why they occur. • Explicitly state methodology, probabilities and variables underlying the forecast in a footnote • Discuss top drivers and restraints impacting the forecast • Feel free to use multiple slides (using no less than 14-pitch font) Source: Frost & Sullivan analysis.
Total XXX Market Percent Revenue Forecast by Region Optional slide: for global or regional studies Key Takeaway: Asia-Pacific is the key engine for market revenue growth in the midterm Note: All figures are rounded. The base year is xxxx. Source: Frost & Sullivan analysis.
Revenue Forecast by Region Optional slide: for global or regional studies Total Transient Voltage Surge Suppression Market: Revenue Forecast by Region, 2008-2016 Source: Frost & Sullivan analysis.
Regional or Global Hot Spots Optional slide: If used, substitute the appropriate map from the PPT TimeSaver Germany Text India Text UK Text Indonesia Text Egypt Text Brazil Text Nigeria Text Source: Frost & Sullivan analysis.
Regional or Global Unit Shipment and Revenue Forecast Discussion Optional slide: for global or regional studies • What interesting trend is happening in the forecast period? • Any KEY facts from the three previous years? Be careful here: do not rehash history that is evident on the chart, keep this part brief—readers want insight about the future, which is generally why they read ME studies • Is your five-year forecast trend line smooth? If peaks or valleys exist in your forecast, explain what they mean and why they occur • Explicitly state methodology, probabilities and variables underlying the forecast in a footnote • Discuss top drivers and restraints impacting the forecast • Feel free to use multiple slides, using no less than 14-pitch font Source: Frost & Sullivan analysis.
Total XXX Market Revenue Forecast by Vertical Market • Key Takeaway: Healthcare will provide greatest growth opportunities in next 5 years Note: All figures are rounded. The base year is xxxx. Source: Frost & Sullivan analysis.
Vertical Market Revenue Forecast Discussion • What interesting trend is happening in the forecast period? • Any KEY facts from the three previous years? Be careful here: do not rehash history that is evident on the chart, keep this part brief—readers want insight about the future, which is generally why they read ME studies • Is your five-year forecast trend line smooth? If peaks or valleys exist in your forecast, explain what they mean and why they occur. • Explicitly state methodology, probabilities and variables underlying the forecast in a footnote • Discuss top drivers and restraints impacting the forecast • Feel free to use multiple slides, using no less than 14-pitch font Source: Frost & Sullivan analysis.
Total XXX Market Percent Revenue Forecast by Distribution Channel • Key Takeaway: VARS will overtake direct sales channels in 2011; Web channel will continue to grow at expense of other routes to market Note: All figures are rounded. The base year is xxxx. Source: Frost & Sullivan analysis.
Distribution Channel Revenue Forecast Discussion • What interesting trend is happening in the forecast period? • Any KEY facts from the three previous years? Be careful here: do not rehash history that is evident on the chart, keep this part brief—readers want insight about the future, which is generally why they read ME studies • Is your five-year forecast trend line smooth? If peaks or valleys exist in your forecast, explain what they mean and why they occur • Explicitly state methodology, probabilities and variables underlying the forecast in a footnote • Discuss top drivers and restraints impacting the forecast • Feel free to use multiple slides, using no less than 14-pitch font Source: Frost & Sullivan analysis.
Total XXX Market Penetration Analysis • Key Takeaway: 2016 Market Penetration is 48%—Penetration reaches 70% in 2015 • Discussion of potential users • Discussion in growth of installed base and market penetration Note: All figures are rounded. The base year is xxxx. Source: Frost & Sullivan analysis.
Competitive Analysis—Market Share • Key Takeaway: Expect mergers in 2011 as attempt to rival Company A’s dominance n = 73 * A list of “Other” companies can be found at link to slide in appendix. Note: All figures are rounded. Source: Frost & Sullivan analysis.
Market Share Evolution • Key Takeaway: Company B’s launch of product X vaulted it ahead of all competitors * A list of “Other” companies can be found at link to slide in appendix. Source: Frost & Sullivan analysis.
Market Share Analysis This slide is an example of a good market share analysis. You are not however, locked into following it exactly and may develop your own approach. EMS Aerospace and Defense Market: Company Market Share Analysis of Top 5 Participants Region, Year The top five XXX participants contributed x% of total market revenue. Acme Inc. lead the competition in 2009 with $278.7 million in revenue. Since the implementation of the company’s 2-part business unit strategy in 2008, Acme has successfully been able to continue it’s rank as the North American market leader. Beta continued to leverage its offering of Radiation hardening (Rad-hard) chips, which are used for high-end military satellites, to accommodate market demand and to solidify itself as a top market leader. Following Beta in market ranking is Gamma Corporation, Zeus Circuit, Inc., and Robot Fowl Corporation. Although the majority of EMS providers, especially top tier participants, experienced a decline in overall revenue in 2009, the sector has provided stability and opportunity to expand market presence and service offerings. * A list of “Other” companies can be found at link to slide in appendix. Note: All figures are rounded. The base year is xxxx. Source: Frost & Sullivan analysis.
Competitive Environment Source: Frost & Sullivan analysis.
Top Competitors Source: Frost & Sullivan analysis.
Competitor B Competitor E Competitor D Competitor C Competitor A > 2% loss > 5% gain 2% loss – 5% gain Competitor Growth Analysis • Key Takeaway: Company A’s acquisition of Company Y gave it the highest growth, but acquisition-associated debt forced the company into a loss in 2010 Competitor Growth Analysis Total Market Name: Region, Period Growth rate 200X-200Y Revenue ($ Million) Profitability Unknown Note: Bubble size represents relative capitalization. The base year is xxxx. Source: Frost & Sullivan analysis.
Competitive Factors and Assessment • You may use several slides to address this section. As many of the following questions as possible should be answered with graphics (from the PPT TimeSaver, preferably) rather than text slides: • Which vendors are growing fastest? • Is the number of vendors growing or is the market consolidating? • Any key acquisitions or mergers during the base year? Why were they important? • What are the tiers of competition? • What are the key end-user groups? • What factors make companies more or less competitive? • Are companies around to stay or are they looking for exit strategies? Source: Frost & Sullivan analysis.
Market Overview—Impact of XXX Industry Mega Trends on the XXX Market • Introduce the Mega Trends report and provide a link to the XXX Industry Mega Trends Report on frost.com. • Excerpt titles of relevant Mega Trends and include a single slide discussion of how each Mega Trend influences this market. • You may omit this slide if your Industry has not yet completed a relevant Mega Trends deliverable or the most recent study is more than one year old Source: Frost & Sullivan analysis.
Mega Trend Impact on XXXX Industry • Key Takeaway: Mega Trend 1 has been embraced by market leaders, but Mega Trend 3 has largely been ignored by their new product development pipelines Mega Trend Impact on XXX Industry Region, Period Impact Ratings: 7-10 = High; 4-6 = Medium; 1-3 = Low Source: Frost & Sullivan analysis.
This section (CEO’s 360 Degree Perspective) should be used if your CBU has a well-developed and current presentation. The CEO’s 360 Degree Perspectiveon the X Industry
CEO’s 360 Degree Perspective • Key Takeaway: The integrated industry perspective is typically ignored by companies in the X industry, and done so at their extreme peril CEO’s 360 Degree Perspective on XXX Industry Region, Period Source: Frost & Sullivan analysis.
CEO’s 360 Degree Perspective (continued) • Insert amplifying slides here if you have a short summary (no more than four slides) of your CBU CEO’s 360 Degree Perspective, with a link to the full study. Source: Frost & Sullivan analysis.


![A note to [CLIENT NAME]](https://cdn2.slideserve.com/4181569/slide1-dt.jpg)