Download

1 / 22
220 likes | 334 Vues
This presentation by Thomas Heinemann at the IPWG meeting in Beijing discusses evolving quality indicators (QIs) for the Multi-Sensor Precipitation Estimate (MPE) algorithm, used to generate real-time rainfall data. The overview covers recent developments in METOP satellite operations, the importance of providing quality information to users, and various validation tests for MPE’s accuracy. Emphasizing enhanced applications for agricultural and hydrological forecasting in regions with limited radar access, it highlights user trust through clear reporting of algorithm performance.

E N D
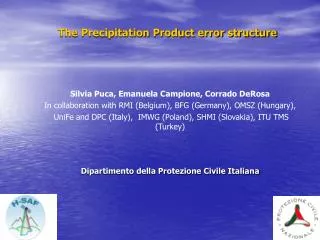
Quality indicators in an operational precipitation product IPWG meeting 4 Beijing, 13-17 October 2008 Presented by: Thomas Heinemann Meteorological Operations Division EUMETSAT thomas.heinemann@eumetsat.int
Overview • News from METOP/HRPT • The Multi Sensor precipitation Estimate (MPE), a real-time precipitation algorithm • Why shall we provide quality information • The MPE quality indicators (QI) • How useful are the MPE QIs • Outlook
News from METOP-A HRPT • METOP-A was launched on 19 October 2006 • LRPT direct data transmission was not activated • HRPT direct data transmission service failed soon after activation • Root cause was heavy ion radiation causing the failure of a component of the AHRPT Solid State Power Amplifier (SSPA) • To minimise the risk of failure to the HRPT-B unit a "partial" HRPT service in those areas where the risk of damage from heavy ions is reduced, has been implemented. • For southbound passes over Europe and the North Atlantic, HRPT side B will be activated starting around 60°N. • First activation was on 29 September 2008 (2 month trial)
MPE: a real-time precipitation algorithm • Combines passive microwave from polar orbiting satellites with IR data from geo-stationary satellites. • Algorithm is based on the classical blending approach. • Instantaneous rain rate data are produced every 15/30min in original Geo-satellite pixel resolution (MET-7 INDOEX, MET-8 RSS, MET-9 0°) in the operational environment of the MSG groundsegment. • Processing is done in near-real time mode with a time delay of < 10 minutes between image acquisition and data dissemination. • Data are provided on the internet and via EUMETCAST in GRIB-2 data format and in addition visualised on the EUMETSAT web-page.
Who are the (designated) users of real-time precipitation algorithms ? • NRT or RT precipitation data are • essential for: • Short term weather forecasts and nowcasting • Operational short term hydrological and acricultural applications Photos: WFP In large areas of the world methods based on ground measurements or polar orbiting satellite products cannot fulfil the NRT requirements and a dense radar network is not available ( Africa, Asia !!!)
Why (still) a blending algorithm ? • EUMETSAT ‘s and its users requirements for the rain-rate algorithm are: • To provide a real-time product in high temporal and spatial resolution. • To use a scientifically mature algorithm which has been proven to work operationally. • Most other algorithm types cannot be used in real-time. • Other real-time algorithm’s are either very similar to the used one or still in development phase. • But tests with other algorithms were done: • Hydro-estimator implemented for South Africa, CMORPH version tested, co-operation with H-SAF and NOAA …
MPE and Hydro-Estimator in South Africa MPE results (left) and Hydroestimator results (right) of the instantaneous rain rate (mm/hour) based on the 10:00 UTC MSG image of 6 November 2007.
MPE validation by the European PEHRPP site Courtesy: Chris Kidd
Why (quantitative) quality indicators? • Users trust data only if they have a clear vision how accurate they are. • Most algorithms perform in some conditions better than in others (especially combined algorithms). • Algorithm developers have more a-priori information available and know their algorithm better than the users. • Many algorithms depend on the results of previous data analysis (eg. cloud mask). The quality of the previous steps affects the quality of the final product. • All this information should be provided to the users. • Different applications need different QI’s!
Continuous re-adjustment of LUTs as source for MPE quality indicators • Blending principle: • Co–located microwave rain-rates and IR brightness temperature for a specific region and time-span are used to derive a monotonic relation between IR BT and rain rate.
Definition of MPE QIs • QI1 := Correlation coefficient between MPE rain-rates for the • co-located IR data and the microwave data rain-rates • QI2 := Standard deviation between MPE rain-rates for the • co-located IR data and the microwave data rain-rates
Test strategy for QIs • Purpose : Test if MPE rain-rates in areas with high QI are really better. • Method: Compare MPE rain rates ffrom the real-time algorithm with microwave rain-rates. • Precondition: None of the microwave rain rates used for the comparison are included in the co-locations. • Limitation: Not a real validation of rain-rates but of the matching-algorithm.
Summary • EUMETSAT committed to continue the operational service for a disk-wide real-time rain-rate product • The current algorithm should be updated to a mature, state-of-the-art algorithm which fulfils the requirements. • The EUMETSAT Hydrology SAF is developing additional algorithms for various applications • Effective and adapted Quality Indicators are essential for the optimal application of precipitation products, especially in models. • The MPE QIs based on the co-location statistics are useful indicators to identify the areas where the MPE algorithm should not be used.