Dimensionality reduction
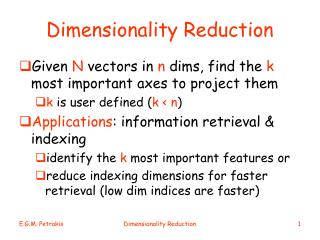
Dimensionality reduction. Outline. From distances to points : MultiDimensional Scaling (MDS ) FastMap Dimensionality Reductions or data projections Random projections Principal Component Analysis (PCA ). Multi-Dimensional Scaling (MDS).

Dimensionality reduction
E N D
Presentation Transcript
Outline • From distances to points : • MultiDimensionalScaling (MDS) • FastMap • Dimensionality Reductions or data projections • Random projections • Principal Component Analysis (PCA)
Multi-Dimensional Scaling (MDS) • So far we assumed that we know both data points X and distance matrix D between these points • What if the original points X are not known but only distance matrix D is known? • Can we reconstruct X or some approximation of X?
Problem • Given distance matrix D between n points • Find a k-dimensional representation of every xipoint i • So that d(xi,xj) is as close as possible to D(i,j) Why do we want to do that?
High-level view of the MDS algorithm • Randomly initialize the positions of n points in a k-dimensional space • Compute pairwise distances D’ for this placement • Compare D’ to D • Move points to better adjust their pairwise distances (make D’ closer to D) • Repeat until D’ is close to D
The MDS algorithm • Input: nxn distance matrix D • Random n points in the k-dimensional space (x1,…,xn) • stop = false • whilenot stop • totalerror = 0.0 • For every i,j compute • D’(i,j)=d(xi,xj) • error = (D(i,j)-D’(i,j))/D(i,j) • totalerror +=error • For every dimension m: xim = (xim-xjm)/D’(i,j)*error • Iftotalerror small enough, stop = true
Questions about MDS • Running time of the MDS algorithm • O(n2I), where I is the number of iterations of the algorithm • MDS does not guarantee that metric property is maintained in d’ • Faster? Guarantee of metric property?
Problem (revisited) • Given distance matrix D between n points • Find a k-dimensional representation of every xipoint i • So that: • d(xi,xj) is as close as possible to D(i,j) • d(xi,xj) is a metric • Algorithm works in time linear in n
FastMap • Select two pivot pointsxa and xb that are far apart. • Compute a pseudo-projection of the remaining points along the “line” xaxb • “Project” the points to a subspace orthogonal to “line” xaxb and recurse.
Selecting the Pivot Points The pivot points should lie along the principal axes, and hence should be far apart. • Select any point x0 • Let x1 be the furthest from x0 • Let x2 be the furthest from x1 • Return (x1, x2) x2 x0 x1
Pseudo-Projections xb Given pivots (xa , xb), for any third point y, we use the law of cosines to determine the relation of y along xaxb The pseudo-projection for y is This is first coordinate. db,y da,b y cy da,y xa
“Project to orthogonal plane” xb cz-cy Given distances along xaxbcompute distances within the “orthogonal hyperplane” Recurse using d ’(.,.), until k features chosen. dy,z z y xa y’ z’ d’y’,z’
The FastMap algorithm • D: distance function, Y: nxk data points • f=0 //global variable • FastMap(k,D) • If k<=0 return • (xa,xb) chooseDistantObjects(D) • If(D(xa,xb)==0), set Y[i,f]=0 for every i and return • Y[i,f] = [D(a,i)2+D(a,b)2-D(b,i)2]/(2D(a,b)) • D’(i,j) // new distance function on the projection • f++ • FastMap(k-1,D’)
FastMap algorithm • Running time • Linear number of distance computations
The Curse of Dimensionality • Data in only one dimension is relatively packed • Adding a dimension “stretches” the points across that dimension, making them further apart • Adding more dimensions will make the points further apart—high dimensional data is extremely sparse • Distance measure becomes meaningless (graphs from Parsons et al. KDD Explorations 2004)
The curse of dimensionality • The efficiency of many algorithms depends on the number of dimensions d • Distance/similarity computations are at least linear to the number of dimensions • Index structures fail as the dimensionality of the data increases
Goals • Reduce dimensionality of the data • Maintain the meaningfulness of the data
Dimensionality reduction • Dataset X consisting of n points in a d-dimensional space • Data point xiєRd (d-dimensional real vector): xi = [xi1, xi2,…, xid] • Dimensionality reduction methods: • Feature selection: choose a subset of the features • Feature extraction: create new features by combining new ones
Dimensionality reduction • Dimensionality reduction methods: • Feature selection: choose a subset of the features • Feature extraction: create new features by combining new ones • Both methods map vector xiєRd, to vector yiєRk, (k<<d) • F : RdRk
Linear dimensionality reduction • Function F is a linear projection • yi = A xi • Y = A X • Goal: Y is as close to X as possible
Closeness: Pairwise distances • Johnson-Lindenstrauss lemma: Given ε>0, and an integer n, let k be a positive integer such that k≥k0=O(ε-2logn). For every set X of n points in Rd there exists F: RdRksuch that for all xi, xjєX (1-ε)||xi - xj||2≤ ||F(xi )- F(xj)||2≤ (1+ε)||xi - xj||2 What is the intuitive interpretation of this statement?
JL Lemma: Intuition • Vectors xiєRd, are projected onto a k-dimensional space (k<<d): yi = R xi • If ||xi||=1 for all i, then, ||xi-xj||2is approximated by(d/k)||xi-xj||2 • Intuition: • The expected squared norm of a projection of a unit vector onto a random subspace through the origin isk/d • The probability that it deviates from expectation is very small
JL Lemma: More intuition • x=(x1,…,xd), d independent Gaussian N(0,1) random variables; y = 1/|x|(x1,…,xd) • z : projection of y into first k coordinates • L = |z|2, μ = E[L] = k/d • Pr(L ≥ (1+ε)μ)≤1/n2and Pr(L ≤(1-ε)μ)≤1/n2 • f(y) = sqrt(d/k)z • What is the probability that for pair (y,y’): |f(y)-f(y’)|2/(|y-y’|) does not lie in range [(1-ε),(1+ ε)]? • What is the probability that some pair suffers?
Finding random projections • Vectors xiєRd, are projected onto a k-dimensional space (k<<d) • Random projections can be represented by linear transformation matrix R • yi = R xi • What is the matrix R?
Finding random projections • Vectors xiєRd, are projected onto a k-dimensional space (k<<d) • Random projections can be represented by linear transformation matrix R • yi = R xi • What is the matrix R?
Finding matrix R • Elements R(i,j) can be Gaussian distributed • Achlioptas* has shown that the Gaussian distribution can be replaced by • All zero mean, unit variance distributions for R(i,j) would give a mapping that satisfies the JL lemma • Why is Achlioptas result useful?
Closeness: Capture data variance or.. • Principal Component Analysis (PCA) • Project data XfromRdtoRk (k<<d) while maximizing the variance of the projected data • Find dimensions that capture most of the “variability” in the data
PCA: Intuition • Intuition: find the axis that shows the greatest variation, and project all points into this axis f2 e1 e2 f1
Reminder of some basic linear algebra • Eigenvalue and Singular Value Decomposition • Definitions of eigenvalues/eigenvectors • Singular values and singlular vectors • Algorithms: Powermethod
Principal component analysis (PCA) • Projection in 1-dimensional space (k=1) • u1: space direction (u1Tu1 =1) • Each xi is projected onto scalar u1T xi • Mean of original points: x’=1/n∑i=1…n xi • Mean of projected points: u1Tx’ • Variance of the projected points: • with
Principal Component Analysis (PCA) • Problem: Find u1 to maximize projected variance: • Subject to the constraint that
Principal Component Analysis (PCA): 1-d case • Problem: Find u1 to maximize projected variance: • Subject to the constraint that • Solution: • Variance is maximum when u1is the eigenvector of Sthat corresponds to the largest eigenvalueλ1
PCA: multidimensional cae • Additional principal components: • Choose a new direction that maximizes the projected variance amongst all possible directions orthogonal to those already considered • Generalized problem: Find k-dimensional linear projection space, for which the variance of the projected data is maximized
PCA: Multidimensional case • Problem: Find u1,…,ukto maximize projected variance: • Subject to the constraint that • Solution: • u1,…,ukare the keigenvectors of the covariance matrix that correspond to the klargest eigenvaluesλ1≥…≥ λk of covariance matrix S
Algorithms for PCA • Evaluate mean x’ • Evaluate covariance matrix S • Find k eigenvectors of S corresponding to the k largest eigenvalues • How can we do that? • What is the computational cost?
PCA: computational cost • Eigenvector decomposition of an nxn matrix: O(n3) • If we only need to find the first k principal components we can use power method: O(kd2)
Singular Value Decomposition: SVD • SVD is closely related to PCA • The data matrix X is decomposed into X = UΣVT • U: left singular vectors of X • V: right singular vectors of X • S: diagonal matrix with the singular values of X • Projected data: UkTX • SVD is also expensive to compu/te – faster methods/approximations exist