Download

1 / 16
160 likes | 335 Vues
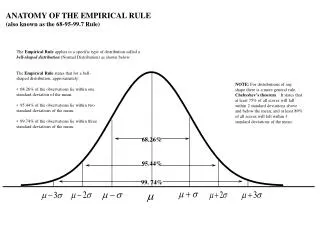
Reinforcing the 68-95-99.7 Rule. Process. Survey data on 391 students Used the Verbal SAT scores Processed the information using MiniTab 15…. Results. Mean: 591.84 Standard Deviation: 73.24. Verbal Z-scores. Took Verbal SAT scores column (Verbal SAT - mean) / s.d.

E N D
Process • Survey data on 391 students • Used the Verbal SAT scores • Processed the information using MiniTab 15…
Results • Mean: 591.84 • Standard Deviation: 73.24
Verbal Z-scores • Took Verbal SAT scores column • (Verbal SAT - mean) / s.d. • …created VerbalZ column -Created histograms comparing the two
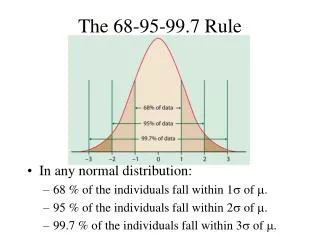
Histogram of Verbal SAT scores • Shows fairly normal shape • Now, compare it to the histogram displaying the VerbalZ scores… • Will it be the same shape? • Any differences?
What if we superimposed the VerbalZ histogram over the Verbal histogram?
Note the discrepancy between the two near the mean… • “The discrepancy has to do with the choices MiniTab makes about what interval midpoints to use” - Prof. Pfenning
Count • <-3 =2/391 • (-3,-2) =5/391 • (-2,-1) =47/391 • (-1, 0) =146/391 • (0,1) =130/391 • (1,2) =49/391 • (2,3) =12/391 • >3 =0/391
Proportion of Standardized Values • -3 to +3 = .995 • -2 to +2 = .951 • -1 to +1 = .706
Observed vs. Expected • -3 to +3 = .995 vs .997 • -2 to +2 = .951 vs .95 • -1 to +1 = .706 vs .68 • So… it appears to be fairly normal
90-95-98-99 Rule • .90 that Z takes a value (-1.645,1.645) • .95 that Z takes a value (-1.960, 1.960) • .98 that Z takes a value (-2.326, 2.326) • .99 that Z takes a value (-2.576, 2.576)
Results for Verbal SATs • .910 that Z takes a value (-1.645, 1.645) • .969 that Z takes a value (-2.326, 2.326) • .979 that Z takes a value (-2.576, 2.576) - How well does this conform to a perfect curve?