
図1 疾病の自然史とスクリーニング可能な時期
図1 疾病の自然史とスクリーニング可能な時期. 健康 生物学的発病 スクリーニングによる検出可能 症状と臨床所見の発現 医療機関受診 診断 治療 転帰(死亡,後遺症,回復). (見かけ上健康) 無 症 状. 表 1 スクリーニングの妥当性. 表2 スクリーニング能力の評価指標. 表3 応用例による各指標の計算(有病率の低い集団). 有病率 =30/540=0.06 (6%). 表4 応用例による各指標の計算(有病率の高い集団). 有病率 =300/810=0.37 (37%). 表5 応用例による各指標の計算(有病率の低い集団).
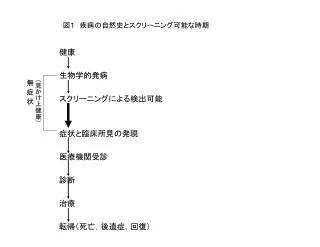

図1 疾病の自然史とスクリーニング可能な時期
E N D
Presentation Transcript
図1 疾病の自然史とスクリーニング可能な時期図1 疾病の自然史とスクリーニング可能な時期 健康 生物学的発病 スクリーニングによる検出可能 症状と臨床所見の発現 医療機関受診 診断 治療 転帰(死亡,後遺症,回復) (見かけ上健康) 無 症 状
表3 応用例による各指標の計算(有病率の低い集団)表3 応用例による各指標の計算(有病率の低い集団) 有病率=30/540=0.06 (6%)
表4 応用例による各指標の計算(有病率の高い集団)表4 応用例による各指標の計算(有病率の高い集団) 有病率=300/810=0.37 (37%)
表5 応用例による各指標の計算(有病率の低い集団)表5 応用例による各指標の計算(有病率の低い集団) 有病率=30/540=0.06 (6%) 6
図2 受信者動作特性曲線による敏感度と偽陽性率の関係図2 受信者動作特性曲線による敏感度と偽陽性率の関係 検査A 検査B 基準線
図3 収縮期血圧区分別CHD死亡率比 ハイリスク 1 ハイリスク 2 Stamler JDほか.MRFIT研究成績より
図4 母集団とCHD死亡者の収縮期血圧分布 ハイリスク 1 ハイリスク 2 母集団 CHD死亡者 Stamler JDほか.MRFIT研究成績より
表6 収縮期血圧によるハイ・リスク者の選択水準とCHD死亡リスク者捕捉率表6 収縮期血圧によるハイ・リスク者の選択水準とCHD死亡リスク者捕捉率 Stamler JDほか.MRFIT研究成績より