Download
1 / 28
280 likes | 502 Vues
AFRICAN PORTS AND MARITIME CONFERENCE. EASTERN & SOUTHERN AFRICAN CHALLENGES IN PORTS DEVELOPMENT. PORT LOUIS HARBOUR. Aruna Bunwaree Ramsaha Deputy Director-General Mauritius Ports Authority. November 2011. A G E N D A. OVERVIEW OF PORT-LOUIS HARBOUR

E N D
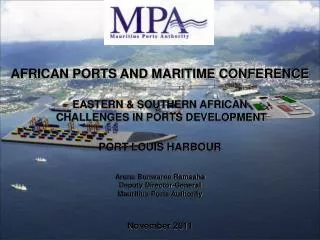
AFRICAN PORTS AND MARITIME CONFERENCE EASTERN & SOUTHERN AFRICAN CHALLENGES IN PORTS DEVELOPMENT PORT LOUIS HARBOUR Aruna Bunwaree Ramsaha Deputy Director-General Mauritius Ports Authority November 2011
A G E N D A OVERVIEW OF PORT-LOUIS HARBOUR EVOLUTION OF CONTAINER TRAFFIC - WORLDWIDE & REGIONWISE STRATEGY OF SHIPPING LINES MAURITIUS MEETING THE CHALLENGES • Extension/Dredging MCT • Capacity Building • Strategic Partnership for Container Handling Operator
Port Louis Harbour Sheltered Port located in the capital city of Port Louis Sole maritime gateway of Mauritius handling 99 % of external trade Contributes 2% to the country’s GDP
Aerial View Terminal I – Fishing Port and quays A, D and E 830 m x 5.5 – 12.2 m Cruise Jetty 124 m x 10.8 m Terminal II – Multipurpose Terminal 700 m x 12.2 m Terminal III – Mauritius Container Terminal 560 m x 14.0 m Oil Jetty 270 m x 14.5 m
Terminal III – Mauritius Container Terminal (MCT) • Commissioned in 1999 • Terminal area: 27.5 ha, Container yard: 15 ha • Annual Throughput capacity: 550,000 TEUs • Dredged depth in Channel : 14.5 m • Total Quay length: 560m • 5 post panamax quay cranes • 8 RTGs • 288 reefer points • Container scanner 560 m long with a dredged depth of 14.0 m @ quay
Port Trade Performance 2010 – Port Louis Harbour Total Traffic 6.2 MT (+6%) Dry Bulk Traffic (Cement, Coal, Wheat, Sugar…) Liquid Bulk Traffic (Petroleum Products, Molasses…) 1.8 MT (+2.) 1.5 MT (+2%) Total Container Throughput 442,654 TEUs(+8%) Captive Container 222,670 TEUs (+15%) Transhipment Container 219,984 TEUs (+3%) Total Fish Traffic 155,773 tonnes (+37%) Vessel Calls 2,172 (+5%) Container vessels: 503(-6%) Fishing vessels : 708 (+10%)
Total Container (Captive + Transhipment) Throughput by Shipping Line - CY2010 * Includes DAL, others
Total Captive (Import + Export) Container Traffic by Shipping Line – CY2010 * Includes DAL, others
Total Transhipment (Empty + Laden) Container Traffic by Shipping Line – CY2010 * Includes PIL, DAL, Coraline, Mitsui, UAFL
Overview of World Container Traffic • Growth in both Container Traffic and Throughput linked to increase in international trade and adoption of containerisation as privileged vector for maritime shipping and inland transportation. • Ratio of Container Traffic to Container Throughput has increased from 3.0 in 1990 to 3.5 in 2008 underlying the complexities of global supply chains. • Based on above trend world Container Throughput expected to increase by 6% to reach 1.1 billion TEUs by 2020. Source: Drewry Shipping Consultants
Container Traffic in East Africa and the Islands The container throughput in South Africa was 3.63 million TEUs in 2010. The other countries on the East Africa coast and the Islands accounted for 2.35 million TEUs in 2010. The total throughput in the South and East African Region is therefore about 6.3 million TEUs. This part of the world is expected to register growth of about 7.4 % annually as from 2011. By 2020 the container traffic may reach 8-10 million TEUs Source: Ocean Shipping Consultant
Strategy of Shipping Lines • Shipping lines are ordering larger and larger container vessels and currently several 18,000 TEUs vessels are on order. • 8,000 + TEUs vessels will be shifted on to the Indian Ocean/ South African region. • MSC has already mobilised three container vessels (Charlston, Chicago and Bussan) having capacity of 8000+TEUs on the South Africa Route. These vessels are calling at Port Louis with a reduced draft and also call at Reunion, Durban and Coega. Piracy attacks in Indian Ocean are forcing shipping lines to review their East-West routes. For e.g vessels plying from Far East to South America whilst avoiding the risky zone have the option to call at Ports located more on southern part thus representing a window of opportunities for Ports such as Port Louis.
Strategy of Shipping Lines (cont’d) • Shipping lines are requesting for additional water depth, good service level, minimum waiting time, competitive port tariff so as to maximise on the vessels capacity and reduce shipping costs. • Shifting from 4000 to 8000 TEUs vessels result in savings on shipping costs of about 20-30 %. • Countries such as Mauritius, have no option but to develop the port to provide longer berth, deeper draft and more powerful tugs. In the recent past, request was received to accommodate Mersk Emma, 11,000 TEUs at Port Louis Harbour. This request could not be entertained even with a reduced draft.
Ports in the Region Geared for Large Vessels The only ports capable to accommodate the 8,000 TEUs vessels without restriction in the area are Coega and Durban. The draft at Port Louis harbour and Reunion are 14 m at berth. The 8000 TEUs vessels are presently calling at Port Louis Harbour with a reduced draft ie not fully loaded. The capacity of the vessels are therefore not being maximised and the benefits to use large vessels are not being met. Most of the existing Quay Cranes are Post Panamax and have an outreach of 16 containers across. The 8000 TEUs vessels have 17 containers across. New RMQC capable to pick a container on the last row will be required. More powerful Tugs will be required to handle these larger vessels
Port Master Plan Study In 2009 Master Plan, Messrs. Halcrow in association with Drewry prepared the forecasts based on data up to 2006 (i.e before financial crisis). Findings: Captive container traffic would increase from 176,000 TEUs in 2006 to 257,000 TEUs in 2015 and 475,000 TEUs in 2030. Transhipment container traffic would increase from 357,000 TEUs in 2006 to 811,000 TEUs in 2015 and 2.3 Million TEUs in 2030 (high case scenario). Consultants recommended the expansion of the Container Terminal so as to obtain a quay length of 1000m and a capacity of 950,000 TEUs.
Traffic Study (Post Financial Crisis) • Another Study carried out by Messrs. AECOM for Port Louis Harbour revealed the following: • Captive traffic will increase in line with GDP i.e. at around 4% • Transhipment traffic will grow at a much lower rate i.e. at 3.5% (low case scenario of Drewry) • Total throughput will reach 615,000 and 817,000 TEUs by 2020 and 2030 respectively.
Case of Port Louis Harbour • Mauritius Container Terminal initially designed as a 2 berths facility for 5,000 TEUs vessel. It is equipped with 5 post panamax cranes with an outreach till the 16th row. • 8,000 TEUs vessels with 17 rows not fully loaded already call at Port Louis. • 8,000 TEUs vessels once fully loaded require dredged depth of 16.5 mts. • Port expansion is required to accommodate larger vessel and resulting extra port capacity will have to be used for transhipment traffic. Mauritius has already a capacity of 550,000 TEUs capable of catering for the captive traffic in the long term.
Case of Port Louis Harbour (cont’d) By not expanding the terminal, there is the risk that shipping lines skip Port Louis. Cargo for Port Louis will be transhipped through other ports. The island will lose precious connectivity causing delays in export of goods. Cost of exports and imports will be increased thus rendering the Mauritian product less competitive on the international market.
Extension of Container Terminal • Proposed extension of about 240 mts in Phase I. • Strengthening and upgrading of existing berths of 560 mts. • Dredging to depth of -16.5 m. • Expansion of Container Yard by 7.5 ha. • Annual throughput capacity of 750,000 TEUs. • Estimated cost of Project: USD 124.0 M • Completion date : End 2014 Phase 1 Phase 2
Extension of the Container Terminal (cont’d) • Phase I Extension Works will yield the following results: • 5 existing post panamax cranes will be able to reach 17th row and service better 8,000 TEUs vessels. • Facilities designed to accommodate two 12,000 TEUs vessels with super post panamax cranes capable of reaching 23rd row. • Designed dredged depth of 18 mts for facility will allow the accommodation of 14,000+ TEUs vessels in the long term. June 4, 2014 Page 20
Dredging to -16.5m • The navigational channel and a box cut of about 150 x 150m beyond the existing • quay has already been dredged to -14.5 m ACD. • Part of the channel (in white) is about 17 m deep. • The area shaded in blue will be dredged to -16.5 m ACD. • The dredging work is expected to be completed with 17 months from start of • work i.e around 3rd quarter of 2013. June 4, 2014 Page 21
240m Extension + Quay Strengthening 13 months 4 months 6.5 months 7.5 months Total Project Duration 31 months June 4, 2014 Page 22
Capacity Building • More powerful tugs required to manoeuvre bigger vessels. • Acquisition of new floating craft: • 1 big tug of 80 tons bollard pull to reinforce existing fleet. • 1 maintenance dredger. • 1 pilot boat • 4 pontoons • Yard equipment being looked into by operator/Strategic Partner.
Strategic Partnership Project • Average pre-berthing delay currently stands at 1.6 hours. • Average number of moves/gross crane hour is around 18. • Berth occupancy currently at 61.4%. • Exercise for selection of a Strategic Partner for Container Handling Operator already engaged. Growth in container traffic is highly dependent on transhipment. To optimise investment in enhanced facilities, transhipment volumes have to be increased. Service level at Port Louis Harbour has to be improved. Presentation Title June 4, 2014 Page 24
Strategic Partnership Project (cont’d) • Criteria for selection of SP include the following: • Selected Strategic Partner would have to guarantee certain transhipment volumes over the concession period. • Strategic Partner would be given the right to assume control over the operations of the Cargo Handling Corporation Ltd. • Strategic Partner would be required to invest in such operations. • After Prequalification exercise, 5 bidders have been shortlisted. • RFP Phase has been launched. • Exercise expected for closure March 2012 Services of International Finance Corporation (IFC) as Transaction Adviser have been retained. Presentation Title June 4, 2014 Page 25