Download
1 / 100
1.01k likes | 1.17k Vues
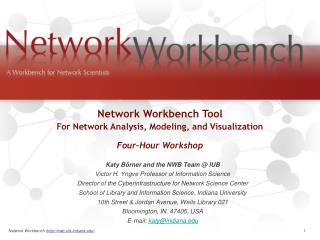
Network Workbench Tool For Network Analysis, Modeling, and Visualization Four–Hour Workshop. Katy Börner and the NWB Team @ IUB Victor H. Yngve Professor of Information Science Director of the Cyberinfrastructure for Network Science Center

E N D
Network Workbench Tool For Network Analysis, Modeling, and Visualization Four–Hour Workshop Katy Börner and the NWB Team @ IUB Victor H. Yngve Professor of Information Science Director of the Cyberinfrastructure for Network Science Center School of Library and Information Science, Indiana University 10th Street & Jordan Avenue, Wells Library 021 Bloomington, IN. 47405, USA E-mail: katy@indiana.edu Network Workbench (http://nwb.slis.indiana.edu). 1
Star Scientist -> Research Teams: In former times, science was driven by key scientists. Today, science is driven by effectively collaborating co-author teams often comprising expertise from multiple disciplines and several geospatial locations (Börner, Dall'Asta, Ke, & Vespignani, 2005; Shneiderman, 2008). Users -> Contributors: Web 2.0 technologies empower anybody to contribute to Wikipedia and to exchange images and videos via Fickr and YouTube. WikiSpecies, WikiProfessionals, or WikiProteins combine wiki and semantic technology in support of real time community annotation of scientific datasets (Mons et al., 2008). Cross-disciplinary: The best tools frequently borrow and synergistically combine methods and techniques from different disciplines of science and empower interdisciplinary and/or international teams of researchers, practitioners, or educators to fine-tune and interpret results collectively. One Specimen -> Data Streams: Microscopes and telescopes were originally used to study one specimen at a time. Today, many researchers must make sense of massive streams of multiple types of data with different formats, dynamics, and origin. Static Instrument -> Evolving Cyberinfrastructure (CI): The importance ofhardware instruments that are rather static and expensive decreases relative to software infrastructures that are highly flexible and continuously evolving according to the needs of different sciences. Some of the most successful services and tools are decentralized increasing scalability and fault tolerance. Modularity: The design of software modules with well defined functionality that can be flexibly combined helps reduce costs, makes it possible to have many contribute, and increases flexibility in tool development, augmentation, and customization. Standardization: Adoption of standards speeds up development as existing code can be leveraged. It helps pool resources, supports interoperability, but also eases the migration from research code to production code and hence the transfer of research results into industry applications and products. Open data and open code: Lets anybody check, improve, or repurpose code and eases the replication of scientific studies. The Changing Scientific Landscape
Division of Labor: Ideally, labor is divided in a way that the expertise and skills of computer scientists are utilized for the design of standardized, modular, easy to maintain and extend “core architecture”. Dataset and algorithm plugins, i.e., the “filling”, are initially provided by those that care and know most about the data and developed the algorithms: the domain experts. Ease of Use: As most plugin contributions and usage will come from non-computer scientists it must be possible to contribute, share, and use new plugins without writing one line of code. Wizard-driven integration of new algorithms and data sets by domain experts, sharing via email or online sites, deploying plugins by adding them to the ‘plugin’ directory, and running them via a Menu driven user interfaces (as used in Word processing systems or Web browsers) seems to work well. Plugin Content and Interfaces: Should a plugin represent one algorithm or an entire tool? What about data converters needed to make the output of one algorithm compatible with the input of the next? Should those be part of the algorithm plugin or should they be packaged separately? Supported (Central) Data Models: Some tools use a central data model to which all algorithms conform, e.g., Cytoscape, see Related Work section. Other tools support many internal data models and provide an extensive set of data converters, e.g., Network Workbench, see below. The former often speeds up execution and visual rendering while the latter eases the integration of new algorithms. In addition, most tools support an extensive set of input and output formats. Core vs. Plugins: As will be shown, the “core architecture” and the “plugin filling” can be implemented as sets of plugin bundles. Answers to questions such as: “Should the graphical user interface (GUI), interface menu, scheduler, or data manager be part of the core or its filling?” will depend on the type of tools and services to be delivered. Supported Platforms: If the software is to be used via Web interfaces then Web services need to be implemented. If a majority of domain experts prefers a stand-alone tool running on a specific operating system then a different deployment is necessary. Desirable Features of Plug-and-Play Macroscopes
Project Details Investigators: Katy Börner, Albert-Laszlo Barabasi, Santiago Schnell, Alessandro Vespignani & Stanley Wasserman, Eric Wernert Software Team: Lead: Micah Linnemeier Members: Patrick Phillips, Russell Duhon, Tim Kelley & Ann McCranie Previous Developers: Weixia (Bonnie) Huang, Bruce Herr, Heng Zhang, Duygu Balcan, Bryan Hook, Ben Markines, Santo Fortunato, Felix Terkhorn, Ramya Sabbineni, Vivek S. Thakre & Cesar Hidalgo Goal: Develop a large-scale network analysis, modeling and visualization toolkit for physics, biomedical, and social science research. Amount: $1,120,926, NSF IIS-0513650 award Duration: Sept. 2005 - Aug. 2009 Website: http://nwb.slis.indiana.edu Network Workbench (http://nwb.slis.indiana.edu). 4
Project Details (cont.) NWB Advisory Board: James Hendler (Semantic Web) http://www.cs.umd.edu/~hendler/ Jason Leigh (CI) http://www.evl.uic.edu/spiff/ Neo Martinez (Biology) http://online.sfsu.edu/~webhead/ Michael Macy, Cornell University (Sociology) http://www.soc.cornell.edu/faculty/macy.shtml Ulrik Brandes (Graph Theory) http://www.inf.uni-konstanz.de/~brandes/ Mark Gerstein, Yale University (Bioinformatics) http://bioinfo.mbb.yale.edu/ Stephen North (AT&T) http://public.research.att.com/viewPage.cfm?PageID=81 Tom Snijders, University of Groningen http://stat.gamma.rug.nl/snijders/ Noshir Contractor, Northwestern University http://www.spcomm.uiuc.edu/nosh/ Network Workbench (http://nwb.slis.indiana.edu). 5
Resources Publications • http://nwb.slis.indiana.edu/pub.html Community Wiki, Tutorials, FAQ • https://nwb.slis.indiana.edu/community • http://nwb.slis.indiana.edu/doc.html • GUESS Manual http://guess.wikispot.org/manual Software • http://cishell.org • http://nwb.slis.indiana.edu/download.html Developer Resources • http://cns-trac.slis.indiana.edu/trac/nwb Network Workbench (http://nwb.slis.indiana.edu). 6
Outline • Exemplary Network Science Research by NWB PIs • Computational Proteomics • Computational Economics • Computational Social Science • Computational Scientometrics • Computational Epidemics • NWB Tool Challenges and Opportunities • NWB Tool Overview • NWB Tool for Scientometrics Research • Discussion of Future Work Network Workbench (http://nwb.slis.indiana.edu). 7
Computational Proteomics What relationships exist between protein targets of all drugs and all disease-gene products in the human protein–protein interaction network? Yildriim, Muhammed A., Kwan-II Goh, Michael E. Cusick, Albert-László Barabási, and Marc Vidal. (2007). Drug-target Network. Nature Biotechnology 25 no. 10: 1119-1126. Network Workbench (http://nwb.slis.indiana.edu). 8
Computational Economics Does the type of product that a country exports matter for subsequent economic performance? C. A. Hidalgo, B. Klinger, A.-L. Barabási, R. Hausmann (2007) The Product Space Conditions the Development of Nations. Science 317, 482 (2007).
Computational Social Science Studying large scale social networks such as Wikipedia Vizzards 2007 Entry Second Sight: An Emergent Mosaic of Wikipedian Activity, The NewScientist, May 19, 2007
Computational Scientometrics 113 Years of Physical Review Bruce W. Herr II and Russell Duhon (Data Mining & Visualization), Elisha F. Hardy (Graphic Design), Shashikant Penumarthy (Data Preparation) and Katy Börner (Concept)
Computational Epidemics Forecasting (and preventing the effects of) the next pandemic. Epidemic Modeling in Complex realities, V. Colizza, A. Barrat, M. Barthelemy, A.Vespignani, Comptes Rendus Biologie, 330, 364-374 (2007). Reaction-diffusion processes and metapopulation models in heterogeneous networks, V.Colizza, R. Pastor-Satorras, A.Vespignani, Nature Physics 3, 276-282 (2007). Modeling the Worldwide Spread of Pandemic Influenza: Baseline Case and Containment Interventions, V. Colizza, A. Barrat, M. Barthelemy, A.-J. Valleron, A.Vespignani, PloS-Medicine 4, e13, 95-110 (2007). Network Workbench (http://nwb.slis.indiana.edu). 12
2. NWB Challenges and Opportunities • Data • Different data formats • Different data models • Algorithms • Different research purposes (preprocessing, modeling, analysis, visualization, clustering) • Different implementations of the same algorithm • Different programming languages • Algorithm developers/users are not computer scientists • Different tools (Pajek, UCINet, Guess, Cytoscape, R, …) • Different communities, practices, cultures Network Workbench (http://nwb.slis.indiana.edu). 13
NWB Deliverables Network Workbench (NWB) Tool • A network analysis, modeling, and visualization toolkit for physics, biomedical, and social science research. • Install and run on multiple Operating Systems. • Supports many file formats. • Easy integration of new algorithms thanks to CIShell/OSGi. • Cyberinfrastructure Shell (CIShell) • An open source, software framework for the integration and utilization of datasets, algorithms, tools, and computing resources. • Extends OSGi industry standard. Network Workbench (http://nwb.slis.indiana.edu). 14
CIShell – Serving Non-CS Algorithm Developers & Users Users Developers IVC Interface CIShell Wizards CIShell NWB Interface Network Workbench (http://nwb.slis.indiana.edu). 15
CIShell – Builds on OSGi Industry Standard CIShell is built upon the Open Services Gateway Initiative (OSGi) Framework. OSGi (http://www.osgi.org) is • A standardized, component oriented, computing environment for networked services. • Successfully used in the industry from high-end servers to embedded mobile devices since 8 years. • Alliance members include IBM (Eclipse), Sun, Intel, Oracle, Motorola, NEC and many others. • Widely adopted in open source realm, especially since Eclipse 3.0 that uses OSGi R4 for its plugin model. Advantages of Using OSGi • Any CIShell algorithm is a service that can be used in any OSGi-framework based system. • Using OSGi, running CIShells/tools can connected via RPC/RMI supporting peer-to-peer sharing of data, algorithms, and computing power. Ideally, CIShell becomes a standard for creating OSGi Services for algorithms. Network Workbench (http://nwb.slis.indiana.edu). 16
NWB Deliverables Network Workbench (NWB) Tool • A network analysis, modeling, and visualization toolkit for physics, biomedical, and social science research. • Install and run on multiple Operating Systems. • Supports many file formats. • Easy integration of new algorithms thanks to CIShell/OSGi. • Cyberinfrastructure Shell (CIShell) • An open source, software framework for the integration and utilization of datasets, algorithms, tools, and computing resources. • Extends OSGi industry standard. • NWB Community Wiki • A place for users of the NWB Tool, the Cyberinfrastructure Shell (CIShell), or any other CIShell-based program to request, obtain, contribute, and share algorithms and datasets. • All algorithms and datasets that are available via the NWB Tool have been well documented in the Community Wiki. Network Workbench (http://nwb.slis.indiana.edu). 17
Network Workbench Toolhttp://nwb.slis.indiana.edu 35,000 in Aug 09 The Network Workbench (NWB) tool supports researchers, educators, and practitioners interested in the study of biomedical, social and behavioral science, physics, and other networks. In Aug. 2009, the tool provides more 160 plugins that support the preprocessing, analysis, modeling, and visualization of networks. More than 40 of these plugins can be applied or were specifically designed for S&T studies. It has been downloaded more than 35,000 times since Dec. 2006. Herr II, Bruce W., Huang, Weixia (Bonnie), Penumarthy, Shashikant & Börner, Katy. (2007). Designing Highly Flexible and Usable Cyberinfrastructures for Convergence. In Bainbridge, William S. & Roco, Mihail C. (Eds.), Progress in Convergence - Technologies for Human Wellbeing (Vol. 1093, pp. 161-179), Annals of the New York Academy of Sciences, Boston, MA.
https://nwb.slis.indiana.edu/community/ Network Workbench (http://nwb.slis.indiana.edu). 19
NWB Tool: Supported Data Formats Personal Bibliographies • Bibtex (.bib) • Endnote Export Format (.enw) Data Providers • Web of Science by Thomson Scientific/Reuters (.isi) • Scopus by Elsevier (.scopus) • Google Scholar (access via Publish or Perish save as CSV, Bibtex, EndNote) • Awards Search by National Science Foundation (.nsf) Scholarly Database (all text files are saved as .csv) • Medline publications by National Library of Medicine • NIH funding awards by the National Institutes of Health (NIH) • NSF funding awards by the National Science Foundation (NSF) • U.S. patents by the United States Patent and Trademark Office (USPTO) • Medline papers – NIH Funding Network Formats • NWB (.nwb) • Pajek (.net) • GraphML (.xml or .graphml) • XGMML (.xml) Burst Analysis Format • Burst (.burst) Other Formats • CSV (.csv) • Edgelist (.edge) • Pajek (.mat) • TreeML (.xml)
NWB Tool: Algorithms (July 1st, 2008)See https://nwb.slis.indiana.edu/community and handout for details.
NWB Tool: Output Formats • NWB tool can be used for data conversion. Supported output formats comprise: • CSV (.csv) • NWB (.nwb) • Pajek (.net) • Pajek (.mat) • GraphML (.xml or .graphml) • XGMML (.xml) • GUESS Supports export of images into common image file formats. • Horizontal Bar Graphs • saves out raster and ps files.
Demo Network Workbench (http://nwb.slis.indiana.edu). 23
NWB Tool Overview • Download, install, and run. • Load, view, convert, save data. • Read and visualize a directory hierarchy. • Load a network, compute its basic properties, and explore it in GUESS. Network Workbench (http://nwb.slis.indiana.edu). 24
NWB Tool Overview • Download, install, and run. • Load, view, convert, save data. • Read and visualize a directory hierarchy. • Load a network, compute its basic properties, and explore it in GUESS. Network Workbench (http://nwb.slis.indiana.edu). 25
Download, install, and run Goto http://nwb.slis.indiana.edu NWB Tool 1.0.0 Select your operating system from the pull down menu. Save as *.jar file. Install and run. Session log files are stored in ‘*yournwbdirectory*/logs’ directory. Network Workbench (http://nwb.slis.indiana.edu). 26
NWB Tool Interface Components Network Workbench (http://nwb.slis.indiana.edu). 27
File, Preprocessing, Modeling, and Visualization Menus Network Workbench (http://nwb.slis.indiana.edu). 28
Analysis Menu and Submenus Network Workbench (http://nwb.slis.indiana.edu). 29
Integrated Tools Gnuplot portable command-line driven interactive data and function plotting utility http://www.gnuplot.info/. GUESS exploratory data analysis and visualization tool for graphs and networks. https://nwb.slis.indiana.edu/community/?n=VisualizeData.GUESS. Network Workbench (http://nwb.slis.indiana.edu). 30
Supported Data Formats In November 2008, the NWB tool supports loading the following input file formats: • GraphML (*.xml or *.graphml) • XGMML (*.xml) • Pajek .NET (*.net) & Pajek .Matrix (*.mat) • NWB (*.nwb) • TreeML (*.xml) • Edge list (*.edge) • CSV (*.csv) • ISI (*.isi) • Scopus (*.scopus) • NSF (*.nsf) • Bibtex (*.bib) • Endnote (*.enw) and the following network file output formats: • GraphML (*.xml or *.graphml) • Pajek .MAT (*.mat) • Pajek .NET (*.net) • NWB (*.nwb) • XGMML (*.xml) • CSV (*.csv) These formats are documented at https://nwb.slis.indiana.edu/community/?n=DataFormats.HomePage. Network Workbench (http://nwb.slis.indiana.edu). 31
NWB Ecology of Data Formats and Converters Not shown are 15 sample datasets, 45 data preprocessing, analysis, modeling and visualization algorithms, 9 services. 13 6 Supported Output formats data for diverse visualization formats algorithms 8 Intermediate data formats Supported by 35 data converters.
Sample Datasets The ‘*yournwbdirectory*/sampledata’ directory provides sample datasets from the biology, network, scientometics, and social science research domains: /biology /network /scientometrics /scientometrics/bibtex /scientometrics/csv /scientometrics/endnote /scientometrics/isi • FourNetSciResearchers.isi /scientometrics/nsf • Cornell.nsf • Indiana.nsf • Michigan.nsf /scientometrics/scopus /socialscience • florentine.nwb The blue ones are used in this tutorial. Network Workbench (http://nwb.slis.indiana.edu). 35
Property Files and Python Scripts The ‘*yournwbdirectory*/” directory also contains /sampledata/scientometrics/properties // Used to extract networks and merge data • bibtexCoAuthorship.properties • endnoteCoAuthorship.properties • isiCoAuthorship.properties • isiCoCitation.properties • isiPaperCitation.properties • mergeBibtexAuthors.properties • mergeEndnoteAuthors.properties • mergeIsiAuthors.properties • mergeNsfPIs.properties • mergeScopusAuthors.properties • nsfCoPI.properties • scopusCoAuthorship.properties /sampledata/scripts/GUESS // Used to do color/size/shape code networks • co-author-nw.py • co-PI-nw.py • paper-citation-nw.py • reference-co-occurrence-nw.py Network Workbench (http://nwb.slis.indiana.edu). 36
NWB Tool Overview • Download, install, and run. • Load, view, convert, save data. • Read and visualize a directory hierarchy. • Load a network, compute its basic properties, and explore it in GUESS. Network Workbench (http://nwb.slis.indiana.edu). 37
Load, View and Save (Convert) Data Use 'File > Load File' to load florentine.nwb in sample datasets in ‘*yournwbdirectory*/sampledata/socialscience’. The loaded file will appear in the Data Manager window. Right click loaded file to save, view, rename, or discard. Network Workbench (http://nwb.slis.indiana.edu). 38
Data Converter Graph There is no central data format. Instead, data formats used in different communities and required by the different algorithms are supported. Network Workbench (http://nwb.slis.indiana.edu). 39
NWB Tool Overview • Download, install, and run. • Load, view, convert, save data. • Read and visualize a directory hierarchy. • Load a network, compute its basic properties, and explore it in GUESS. Network Workbench (http://nwb.slis.indiana.edu). 40
Reading and Visualizing a Directory Hierarchy Use ‘File > Read Directory Hierarchy’ with parameters Visualize resulting ‘Directory Tree - Prefuse (Beta) Graph’ using • ‘Visualization > Tree View (prefuse beta)’ • ‘Visualization > Tree Map (prefuse beta)’ • ‘Visualization > Balloon Graph (prefuse alpha)’ • ‘Visualization > Radial Tree/Graph (prefuse alpha)’ Network Workbench (http://nwb.slis.indiana.edu). 41
Different views of the /nwb directory hierarchy. Note the size of the /plugin directory. Network Workbench (http://nwb.slis.indiana.edu). 42
NWB Tool Overview • Download, install, and run. • Load, view, convert, save data. • Read and visualize a directory hierarchy. • Load a network, compute its basic properties, and explore it in GUESS. Network Workbench (http://nwb.slis.indiana.edu). 43
Compute Basic NW Properties & View in GUESS Select florentine.nwb in Data Manager. • Run ‘Analysis > Network Analysis Toolkit (NAT)’ to get basic properties. • Optional: Run ‘Analysis -> Unweighted & Undirected -> Node Betweenness Centrality’ with default parameters. • Select network and run ‘Visualization > GUESS’ to open GUESS with file loaded. • Apply ‘Layout -> GEM’. Network Workbench (http://nwb.slis.indiana.edu). 44
Pan: “grab” the background by holding left-click and moving your mouse. Zoom: Using scroll wheel, press the “+” and “-” buttons in the upper-left hand corner, or right-click and move the mouse left or right. Center graph by selecting ‘View -> Center’. Select to select/move single nodes. Hold down ‘Shift’ to select multiple. Right click to modify Color, etc. Network Workbench (http://nwb.slis.indiana.edu). 46
Graph Modifier: Select “all nodes” in the Object drop-down menu and click ‘Show Label’ button. Select “nodes based on ->”, then select “wealth” from the Property drop-down menu, “>=” from the Operator drop-down menu, and finally type “50” into the Value box. Then a color/size/ shape code. Network Workbench (http://nwb.slis.indiana.edu). 47
Interpreter: Uses Jython a combination of Java and Python. Try colorize(wealth, white, red) resizeLinear(sitebetweenness, 5, 25) Network Workbench (http://nwb.slis.indiana.edu). 48
Modularity at data preprocessing/analysis/modeling level. Modularity at visualization level: ‘Data Layers’ are used in GIS systems to support the visual layering and coordination of different datasets, e.g., water pipes, streets, electricity lines, etc. ‘Design Layers’ supported by graphic design software such as Photoshop or Dreamweaver enable the separate design and modular composition of design elements. ‘Visualization Layers’ define distinct parts with very specific functionality that collectively define a visualization. Workflow Design Primer