Pulse Oximeters
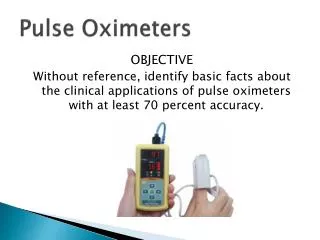
Pulse Oximeters. OBJECTIVE Without reference, identify basic facts about the clinical applications of pulse oximeters with at least 70 percent accuracy. Pulse Oximeters. Purpose Provides continuous, noninvasive monitoring of patient oxygenation

Pulse Oximeters
E N D
Presentation Transcript
Pulse Oximeters OBJECTIVE Without reference, identify basic facts about the clinical applications of pulse oximeters with at least 70 percent accuracy.
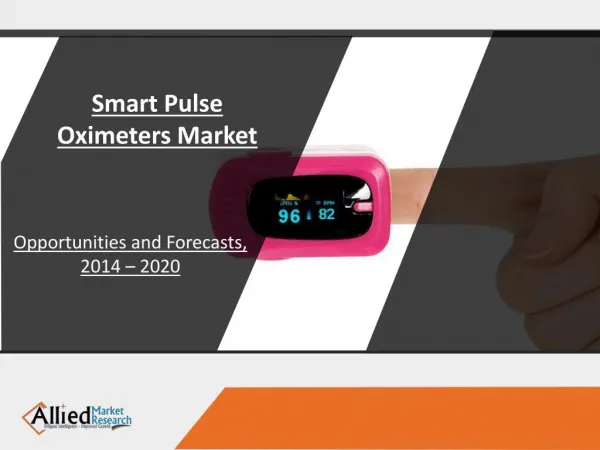
Pulse Oximeters • Purpose • Provides continuous, noninvasive monitoring of patient oxygenation • Provides rapid indication of a patient’s changing level of oxygenation
Pulse Oximeters (Continued) • Determines arterial blood oxygen saturation (SpO2) using spectrophotometricoximetryprinciples • SpectrophotometricOximetry is the measurement of blood oxygen concentration using an instrument that makes measurements based on the comparison of light being output to the amount received. The more light received the less that was absorbed by the blood. • Determines pulse rate using plethysmographictechniques
Pulse Oximeters (Continued) • Principles • Differential light absorption is used to determine the percent of oxygen saturation of hemoglobin in arterial blood • Hemoglobin - an iron-containing compound found in red blood cells that carries oxygen from the lungs to the body tissues • Two different wavelengths of light • Red • Infrared
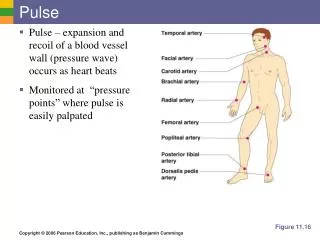
Pulse Oximeters (Continued) • Emitted from a probe • Passes through a pulsating arterial bed • Fingertip • Earlobe • Forehead • To a photodetector
Pulse Oximeters (Continued) • Light absorption • Absorption characteristics • Oxygenated hemoglobin absorbs less than deoxygenated hemoglobin at the red wavelength • They are more similar at the infrared wavelength • Each pulse of arterial blood causes small arteries and arterioles to expand and contract, this varies the amount of light absorbed by the arterial blood
Pulse Oximeters (Continued) • A portion of the passing light is absorbed by tissue constituents • Venous blood • Muscle • Cartilage • Bone • The absorption due to these constituents is constant allowing the microprocessor to eliminate them from the calculations
Pulse Oximeters (Continued) • Plethysmographic technique • Plethysmogram corresponds to the patient's pulse waveform • This signal is used to calculate the patient's pulse rate, and is determined from the peaks of the arterial blood waveforms
Pulse Oximeters (Continued) • Sensor probes • Transmittance probes - light from each LED is passed through the measurement site to a single photodetector on the opposite side
Pulse Oximeters (Continued) • Reflectance probes - light scattered along the tissue surface is collected by a photodetector adjacent to the LED
Pulse Oximeters (Continued) • In both probes, LED's alternately pulse on and off • This allows differentiation between red and infrared light at the photodetector
Patient Monitoring Systems OBJECTIVE Without reference, identify basic facts about the clinical applications of patient monitoring systems with at least 70 percent accuracy.
Patient Monitoring Systems • Intended Purpose -To watch or monitor a patient's vital signs and display waveforms and/or numerical data
Patient Monitoring Systems • Vital signs • Heart rate and ECG • When the heart contracts an electrical signal can be detected by electrodes placed on the patient's chest and extremities • This electrical signal can be plotted as a function of time, and the resultant waveform is referred to as an electrocardiogram (ECG)
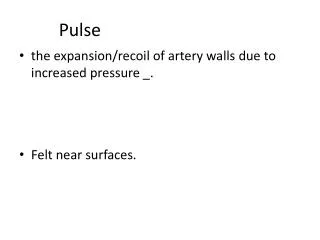
Patient Monitoring Systems (Continued) • Pulse • Temperature • Blood pressure • Systolic - the peak blood pressure felt in the circulatory system • Diastolic - the resting pressure of heart • Mean - average of the systolic and diastolic
Patient Monitoring Systems (Continued) • Respiration • Arterial O2 saturation • Cardiac Output • Airway CO2 Concentration
Patient Monitoring Systems (Continued) • The medical and nursing staff analyze these physiological parameters • To reveal changes in patient's condition • To determine proper treatment • Typical locations • Acute care units • Intensive care units • Cardiac care units • Surgery and recovery units
Patient Monitoring Systems (Continued) • Description of Monitoring Systems • Bedside monitor mainframe • Has a display and possibly a printer • Can be switched with any bedside monitor • Has ports for different modules or different modules are built in
Patient Monitoring Systems (Continued) • Modules of a bedside monitor • ECG module • Amplification of the cardiac signal is performed within the ECG module • Displays electrical activity of the heart by waveform presentation on CRT • Can display • Heart rate - determined from the R to R interval • Heart irregularities
Patient Monitoring Systems (Continued) • Heart rate alarms • Tachycardia - heart rate is too fast • Bradycardia - heart rate is too slow
Patient Monitoring Systems (Continued) • Blood pressure module • To monitor patients when fluids are being lost; in burn victims or major surgery • To monitor patients when fluids are gained; during infusions of blood or other fluids
Patient Monitoring Systems (Continued) • To detect hypotension (low blood pressure) which can lead to vascular collapses because of hypovolemia (low blood volume) • To detect hypertension (high blood pressure) which can overload the heart because of hypervolemia (high blood volume)
Patient Monitoring Systems (Continued) • Temperature module (body temperature) • Usually measured by means of a thermistor probe • Probe is inserted in mouth, armpit, or rectum
Patient Monitoring Systems (Continued) • Respiration module • Methods • Most common - impedance pneumography - measurement of the change of impedance across patient's chest during respiration
Patient Monitoring Systems (Continued) • Pressure sensitive capsules placed on abdomen to detect body movement • Thermistor near mouth or nose to measure change in temperature between inhaled and exhaled breaths • May also include an apnea alarm
Patient Monitoring Systems (Continued) • Carbon dioxide (CO2) module • Measures CO2 concentration at the end of an exhaled breath • Two types • Capnograph • Measures the increase and decrease in CO2 during each inspiratory / expiratory cycle • Displays both CO2 waveform and numerical data
Patient Monitoring Systems (Continued) Capnometer • Continuously measures CO2 • Displays only numerical data • When connected to a patient monitor, becomes a capnograph
Patient Monitoring Systems (Continued) • Pulse oximeter module • Noninvasive and continuous means of monitoring percent of O2 saturation (SaO2) of arterial blood • Reduces the need for arterial puncture and blood gas analysis
Patient Monitoring Systems (Continued) • Physiological monitors are often equipped with 2 types of alarms • System faults • Loose electrodes • Defective electrodes • Physiological parameters have exceeded the limits set by the operator
Electrocardiograph OBJECTIVE Without reference, identify basic facts about the clinical applications of electrocardiograph units with at least 70 percent accuracy.
Electrocardiograph Units • Intended Purpose • To detect the electrical activity of the heart and produce an electrocardiogram (ECG) which is a graphic record of voltage versus time • To diagnose cardiac abnormalities • To monitor patient's response to drug therapy
Electrocardiograph Units (Continued) • To revel major changes in heart rate and cardiac rhythm (ECG disturbances) • Pericarditis - inflammation of the sac containing the heart • Atria and ventricular hypertrophy - enlargement f the walls due to obstruction • Myocardial infarctions - coagulation in the muscular tissue of the heart resulting from obstruction of circulation
Electrocardiograph Units (Continued) • Ventricular fibrillation • Asystole • Electrolyte concentrations and acid base balance • Increased metabolic activity • Drug reactions • Hypoxemia - low oxygen content in the blood • Hypothermia - low body temperature
Electrocardiograph Units (Continued) • ECG monitors typically measure and display up to three physiological parameters • Electrocardiogram (ECG) • Heart rate • Body temperature or respiration
Electrocardiograph Units (Continued) • Elements of the ECG • P-wave - represents depolarization of both atria • Begins with electrical impulse from the SA node • Impulse spreads in wave-like fashion, stimulating both atria • Both atria depolarize (contract) and produce electrical activity
Electrocardiograph Units (Continued) • PR Segment • Electrical impulse from atria passes to the AV node • There is a 1/10 second pause allowing blood to enter the ventricles • The AV node is depolarized • Duration - .12 - 2.0 seconds • Measures from the onset of the P-wave to the onset of the QRS complex
Electrocardiograph Units (Continued) • QRS complex • Represents the electrical impulse as it travels from the bundle of HIS into the bundle branches into the Purkinje fibers and into the myocardial cells (causing ventricular contraction) • The depolarization of the ventricles • Duration - .08 - .12 seconds
Electrocardiograph Units (Continued) • Consists of: • Q-wave • First down stroke of the QRS complex • Not always present • R-Wave - first upward deflection of the QRS complex • S-Wave - first downward stroke after the R-wave
Electrocardiograph Units (Continued) • ST segment • Used to identify myocardial infarctions • Serves as the isoelectric line from which to measure the amplitudes of other waveforms • J-point - junction between the QRS complex and the ST segment • T-wave - represents the repolarization of the ventricles
Electrocardiograph Units (Continued) • Principles of Operation • The heart rate is determined by the R to R interval of successive QRS waves • Electrocardiographs record small voltages (about 1mv) that appear on the skins surface as a result of cardiac activity by using various electrode configurations discussed earlier
Electrocardiograph Units (Continued) • Multichannel electrocardiographs • Operate similarly to single channel units in that the user selects certain similar functions: • Automatic or manual lead switching • Signal sensitivity • Chart speed
Electrocardiograph Units (Continued) • Unlike signal channel units, multichannel units have some advantages: • Record 3 or more leads simultaneously • Tracings can be held in memory • Tracings are printed out in a one-page format
Electrocardiograph Units (Continued) • Modes • Manual mode • User selects three leads to be recorded • Unit traces signal from these leads until others are selected
Electrocardiograph Units (Continued) • Automatic mode • Each standard 12 leads are recorded for a preset time period • Switching from one lead to another occurs automatically • Some units can be programmed to record tracings from any lead sequence
Electrocardiograph Units (Continued) • Units with integral timers and selectable chart speeds can also be programmed for • Stress testing • Trending • Rhythm monitoring • Semi-automaticmode • Recorder scans through first lead group
Electrocardiograph Units (Continued) • Semi-automaticmode • Recorder scans through first lead group • Then switches to observe mode • Allows user to preview next lead group for signal quality before recording • User restarts recording of next group manually • Lead hold feature • Overrides programmed timer • Allowing longer recording time for a particular lead
Electrocardiograph Units (Continued) • Sensitivity setting • User selectable • Determines size of the recorded ECG waveform • ECG signals that become too large and produce a waveform that goes over scale (arrhythmic beat) • Most units will automatically switch to lower sensitivity setting immediately
Electrocardiograph Units (Continued) • Other units allow user to choose between recording • Affected channel at lower sensitivity • All channels at lower sensitivity • Waveform as is, followed by re-recording at lower sensitivity
Electrocardiograph Units (Continued) • Frequency response • Factory-set to detect ECG signals between 0.05 and 100 Hz for diagnostic purposes • Electrical interference also occurs within this range producing artifacts by recording • Muscle movement • Line power frequency
Electrocardiograph Units (Continued) • To reduce such interference, notch filters can be selected to block these frequencies • Because filters limit frequency response, they can affect diagnoses based on certain details (amplitude) • Therefore, they are not usually used for diagnostic recording