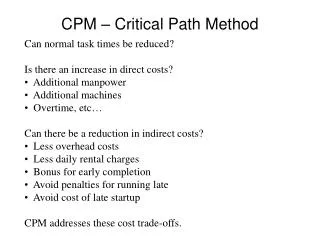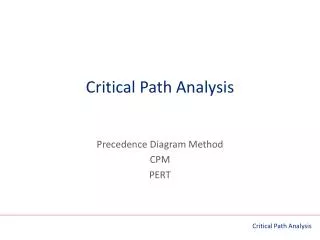
Critical Path Method(CPM)
Critical Path Method(CPM). Critical Path Method (CPM). A project planning and scheduling technique CPM is part of group of techniques called Network Models CPM is broken into: Creating Work Breakdown Structure Creating a Network Diagram of the Project

Critical Path Method(CPM)
E N D
Presentation Transcript
Critical Path Method (CPM) • A project planning and scheduling technique • CPM is part of group of techniques called Network Models • CPM is broken into: • Creating Work Breakdown Structure • Creating a Network Diagram of the Project • Computing Activity Times and Activity Total Float • Computing the Project Duration and Critical Path • Creating an Activity Schedule Table • Creating a GANTT Chart Schedule
Work breakdown structure (WBS) Figures 8.1 - 8.3 Work breakdown structures
Product breakdown structure (PBS) Figures 8.5 – 8.8 Product breakdown structures
Product flow diagram Figure 8.9 PRINCE2® product flow diagram
Product description • Purpose • Composition • Derivation • Quality/completion criteria • Can add: • Format • Related products • Review methods
Work packages Figure 8.10 Work packages for a training course
Linear responsibility chart Figure 8.11 Linear responsibility chart
Establishing Activity Precedence Some activities must be down before others
Network diagram (activity-on-arrow) Figure 8.12 Network diagram (activity-on-arrow format)
Network with durations & critical path Activities if delayed will delay the whole project (the activities with the longest path) Figure 8.13 Network diagram with durations & critical path added
Activity Times • Activity Earliest Start Time (EST) • Activity Earliest Finish Time (EFT) • Activity Latest Start Time (LST) • Activity Latest Finish Time (LFT)
Network diagram (activity-on-node) EFT Activity Name EST Activity Duration LST LFT Figure 8.15 Network diagram (activity-on-node format)
Effort and elapsed time • Effort = total volume of work • Elapsed time depends on effort and also: • How many resources are available • What proportion of their time is available to the project • Delays outside the team’s control (eg lead times for hardware) • Dependencies on others
Activity Total Float • Is the amount of time that an activity can be delayed without affecting overall project duration • Formula: Activity Total Float = Activity LST –Activity EST • Activities with total float 0 cannot be delayed without delaying the whole project • Activities with some total float give some leeway in rescheduling them without delaying the whole project • However, when we use up the total float on an activity, it may cause later activities to be delayed and this will reduce their total floats
Components of Total Float • 2 components of Total Float • Free float: • Part of total float whose usage will not cause subsequent activites to be delayed and thus will not affect total float • Interfering float: • Part of total float whose usage will cause subsequent activities to be delayed and thus will affect their total floats
Free Float • The delay activity without affecting the total float of subsequent activities • Formula: Free Float = min. EST of Activity’s successors – Activity EFT 24 28 J,4 26 30 TF=3 FF=3 Free Float= min(23 and 24) -20 • 20 • G,1 • 22 23 23 29 G,1 23 29
Use of Activity Float • I ffor certain reasons you were force to delay some activities in a project, you would first choose to delay activities with free float. Once you have run out of such activities, you would then delay activities with interfering float. • In delaying such activites you would have to recompute the total float of all subsequent activities as they may have disappeared • Choose to delay activities without any total float only as a last resort as doing so would cause the project to be delayed
Project Duration and Critical Path • The shortest possible project duration is equal to the EST of the END activity • The critical path is the path comprising all activities with zero total float. Delays in any of the activities in the critical path will result in delaying the entire project. We can identify the critical path by looking for all activities with zero total float • The critical path is also always the longest continuous path activities in a network diagram from the beginning to the end of a project. The duration of the critical path is always equal to the shortest possible project duration • It is usual to label the critical path by coloring, highlighting it or by drawing two small strokes across all activities in the critical path
Timing Convention • “End of Date”: Day 0 means “End of Day 0” • “Start of Date”: Day 1 means “Start of Day 1” • If use “Start of Date” for start dates and “End of Date” for finish dates, and activity starting on Day 1 and ending on Day 2 has a duration of 2 (and not 1) days
Network diagram Figure 10.1 Dependency network with activity durations
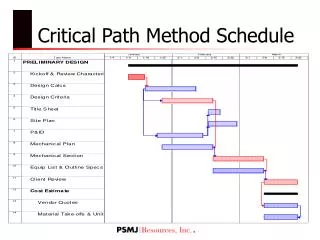
Gantt Chart Schedule (Bar chart) EST Duration Figure 10.3 Schedule for two-person team showing parallel activities
Bar chart with milestones added Figure 10.6 Bar chart showing project milestones
Bar chart with ‘overhead’ task added Figure 10.7 Bar chart showing project management as continuous activity over project
Bar chart and resource histogram Figure 10.8 Bar chart with resource histogram
PRINCE2® plans Figure 10.10 PRINCE2® plans
Contents of PRINCE2® project/stage plan Figure 10.11 Contents of PRINCE2® project and stage plans
Project budget Figure 10.13 Example budget for an IT project