Download
1 / 32
320 likes | 520 Vues
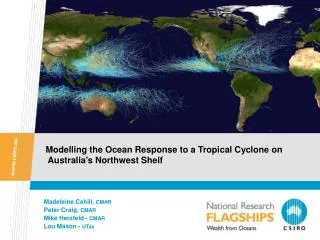
Modelling the Ocean Response to a Tropical Cyclone on Australia's Northwest Shelf. Madeleine Cahill, CMAR Peter Craig, CMAR Mike Herzfeld - CMAR Lou Mason - UTas. Can we model the ocean response to tropical cyclones ?. Tropical cyclones: infrequent, small, energetic

E N D
Modelling the Ocean Response to a Tropical Cyclone on Australia's Northwest Shelf Madeleine Cahill, CMAR Peter Craig, CMAR Mike Herzfeld - CMAR Lou Mason - UTas
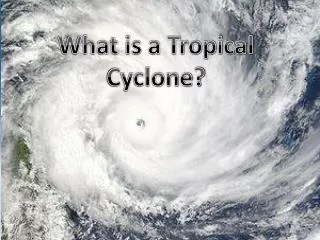
Can we model the ocean response to tropical cyclones ? • Tropical cyclones: infrequent, small, energetic • Dynamic atmospheric models have little skill in generating TCs • Observations of cyclones in Australia are generally land based • In situ observations of ocean response are rare. • Effects are devastating (oil rigs, coastal regions…)
Ocean observations NWS – 1995 current meter deployment xcurrent meter mooring ADCP
SHOC - CSIRO’s Coastal Ocean Model • 3-D primitive equation hydrodynamic model • Arakawa C-grid • free surface • vertical z coordinates • a choice of turbulence closure schemes Our application • 4km & 20km horizontal grid resolution • 46 z-levels • k-e turbulence closure scheme • Horizontally uniform vertical temperature profile with a 20m mixed layer
Tropical Cyclone Model Double vortex Holland model - track prescribed - radius to maximum winds determined by fitting to available wind and pressure observations
Tropical Cyclone Model ParametersRadius to maximum winds Central pressure deficit Two Holland wind fields:Bobby1 (blue),Bobby2 (pink)
Holland wind fields - wind stressmagnitude ocean current vectors (pink)Bobby1 Bobby2
Filtered current vector timeseriesADCP mooring in 125m (central site)
Modelled ocean response at ADCP mooring Wind forcing: Bobby1 Bobby2
Comparing response to two wind fields: Bobby1 (m) and Bobby2 (black) at the ADCP (125m) Alongshore component Cross-Shelf component
Comparing response to Bobby1(m) and Bobby2(black) at offshore mooring (M2 in 300m) Alongshore component Cross-shelf component
Velocities at ADCP location Observations (blue) v SHOC (mag)
Conclusions • Model-data fit is starting to look pretty good • Model response is very sensitive to TC extent and location Further work • compare SHOC results with ROMS • explore the effect of different vertical mixing schemes (using temperature as well velocity for verification) • There are a further 11 TCs for which we have some current and temperature observations from the NWS.
Thank you Email:madeleine.cahill@csiro.au Web:www.cmar.csiro.au