Download
1 / 5
50 likes | 78 Vues
Are you tracking the right ecommerce metrics to scale your business? Measuring the effectiveness of your e-commerce search engine can be tricky. Depending on high-level metrics such as revenue and conversion rate is nearly impossible since these are influenced by many other factors also. Read this presentation to know about how to measure effectiveness of your e-commerce search. Read now!

E N D
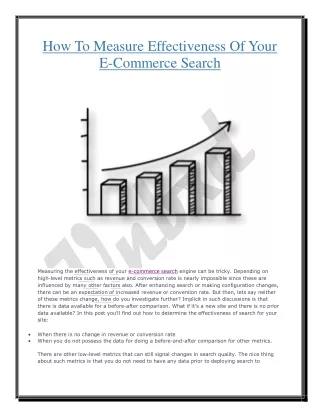
How To Measure Effectiveness Of Your E-Commerce Search Measuring the effectiveness of your e-commerce search engine can be tricky. Depending on high-level metrics such as revenue and conversion rate is nearly impossible since these are influenced by many other factors also. After enhancing search or making configuration changes, there can be an expectation of increased revenue or conversion rate. But then, lets say neither of these metrics change, how do you investigate further? Implicit in such discussions is that there is data available for a before-after comparison. What if it’s a new site and there is no prior data available? In this post you’ll find out how to determine the effectiveness of search for your site: When there is no change in revenue or conversion rate When you do not possess the data for doing a before-and-after comparison for other metrics. There are other low-level metrics that can still signal changes in search quality. The nice thing about such metrics is that you do not need to have any data prior to deploying search to
determine how much benefit search is having for your site. Once collected, they are also a great way to track search quality henceforth. So lets dive in! Search Contribution to Transactions IOW, the %age transactions that are taking place through search. This metric is an indicator of how many transactions are taking place when visitors find products of interest through search. The other ways users can find products are: through an SEO/SEM landing page, those that are taking place through a visitor’s manual browsing of the product catalog/categories Email marketing campaigns, etc. All of the above will combine to give you a 100% score. This score will tell you where most of your transactions are coming from. It is an indicator of whether search is a driver of transactions.High
Conversions from SearchIf the %age of conversions from search is high, as in the pie chart above, we can say that search is a major contributor to your revenue and you need to pay a lot more attention to the quality and accuracy of search results. Low Conversions from SearchIn contrast, if conversions from search are low, we need to determine the reason behind the low conversions from search. This can be because of poor relevance of search results to unattractive prices on the search results page. Lets try finding out how the search quality looks like. Search Vs. Browse %ages Once a visitor is on your site, there are two things he can do[Note 2]. He can either look for products of interest through the search engine or browse through your product catalog. At this step, we need to look at what %age of visitors end up using search for locating products versus those that end up simply browsing through the product catalog.Search Queries and Product RanksWhen the visitors are spending more time searching for products, the chart will look something like the image above. If the conversion source chart earlier shows that the conversions from search are low even when visitors are spending more time searching, it is a definite indication that there is
something wrong with the search results. It could be due to irrelevant search results or due to a UI/UX issue with the results page. We’ll investigate this with Click-through rates in the later section.Low Search Activity over Browsing or Catalog NavigationOn the other hand, if the search activity is far less than the browsing or catalog navigation, then you can rest assured that the conversions from search are low simply because your visitors are not naturally inclined to use search while looking for products of interest. Click-through Rate on Search Results Page A click on a product in the list of products on a search results page is one click-through. If a user ends up clicking on at least one product after every search query, you will observe a click-through rate of 100%. This metric will tell us what percentage of visitors is actually clicking on the products being displayed in the search results. If the number is high, it means that the quality of search results is high. If the number is low, it means that either the results being shown to users are not relevant enough or another factor like product price is driving visitors away from clicking on the product. To discover something about the search quality, lets take a look at the next metric. Average First-Click Rank Click Rank is the rank of the product when it is clicked on the search results page. First-Click Rank is the rank of the product that is clicked first on the search results page. For eg, for two search queries, the order of displaying the results on a results page is:Search Queries and Product RanksFor query 1, A’s rank is 1, B’s rank is 2 and C’s rank is 3. If the user clicks on Prod C first, then the First-Click Rank of this search query is 3. For query 2, E’s rank is 1, F’s rank is 2 and G’s rank is 3. If the user clicks on Prod E first, then the First-Click Rank of this search query is 1. Using these two data points, the Average First-Click Rank of the site will be: ( First-Click Rank for Query 1+ First-Click Rank for Query 2 ) / No. of Search Queries = 2 For Average First-Click Rank, lower is better. The point is, if the average value for this metric is lower, it will mean that the first clicks across the site after search
take place on the most relevant result. If the value is closer to 1, we can safely assume that the search results are highly relevant for site. If the value is low, we’ll know that the search engine is throwing up the relevant results. On the other hand, if the value is high, it is an indicator that either due to search quality or another reason[Note 1], your visitors are not liking the products being displayed on the top of the search results page. [Note 1] Other reasons can range from the high prices displayed for each product on the results page, to out of stock products, which are still relevant from a search perspective but not from a conversion one. [Note 2] There may be other actions the user can take but for the purpose of this investigation, lets just assume there are only two, searching and catalog navigation using the left side menu. Source: https://unbxd.com/blog/how-to-measure-effectiveness-of- your-e-commerce-search/