PVC Water Pipe
1.08k likes | 1.14k Vues
During the use stage of pressure pipe, pumps overcome friction<br>and elevation head to move water through the pipe; this generally<br>contributes the highest of the overall life cycle impacts of potable<br>PVC water pipe. This study demonstrates that compared to other<br>pipe materials during use stage, PVCu2019s attributes reduce the friction<br>head component of energy use and resulting environmental impacts.<br>Second to the use stage, and for non-pressure storm water and sewer<br>pipe, the cradle-to-gate stage is generally the primary source of<br>environmental impacts.

PVC Water Pipe
E N D
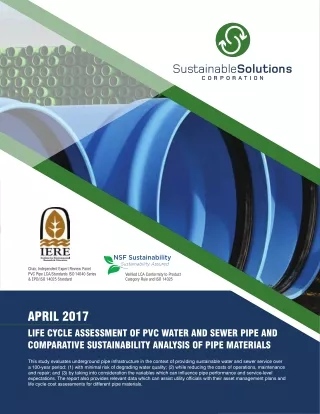
Presentation Transcript
Chair, Independent Expert Review Panel Member, Independent Expert Review Panel | PVC Pipe LCA (Standards ISO 14040 Series) and EPD (ISO 14025 Standard) PVC Pipe LCA/Standards ISO 14040 Series & EPD/ISO 14025 Standard Verified LCA Conformity to Product Category Rule and ISO 14025 APRIL 2017 LIFE CYCLE ASSESSMENT OF PVC WATER AND SEWER PIPE AND COMPARATIVE SUSTAINABILITY ANALYSIS OF PIPE MATERIALS This study evaluates underground pipe infrastructure in the context of providing sustainable water and sewer service over a 100-year period: (1) with minimal risk of degrading water quality; (2) while reducing the costs of operations, maintenance and repair; and (3) by taking into consideration the variables which can influence pipe performance and service-level expectations. The report also provides relevant data which can assist utility officials with their asset management plans and life cycle cost assessments for different pipe materials.
The PVC pipe LCA was subject to critical review from an international panel of experts on life cycle assessment. Based on the results from the LCA on PVC pipe, PVC pipe provides both environmental and economic advantages to solving the water and sewer infrastructure needs for utilities and municipal projects. The LCA and research conducted for this study show that PVC has lower environmental impacts from a life cycle and carbon footprint perspective – lower embodied energy, lower use-phase energy and longer life attributes compared to other pipe materials. It is important for engineers and municipal officials to understand all life cycle aspects of piping materials and utilize current and complete data to assess life cycle environmental impacts for piping infrastructure. This report is presented at a time when aging piping infrastructure, underground corroded pipe materials and water quality issues are at the forefront, highlighting significant challenges with the nation’s water and wastewater infrastructure. FOREWORD This 2017 Life Cycle Assessment of PVC Water and Sewer Pipe and Comparative Sustainability Analysis of Pipe Materials is the first comprehensive environmental review of underground piping systems in North America based on a 100-year life cycle assessment methodology. The overall review includes a study of polyvinyl chloride (PVC) pipe conducted according to life cycle assessment (LCA) standards ISO 14040 series, and subsequent publication of a PVC pipe Environmental Product Declaration (EPD), which complies with ISO 14025 standards and was independently certified by NSF International. Sustainable Solutions Corporation (SSC) is a firm recognized as an expert in life cycle assessment and sustainable product design and analysis. To ensure industry transparency, Uni-Bell PVC Pipe Association commissioned SSC to perform an independent LCA for commonly used PVC pipes for drinking water, sanitary sewer, and storm sewer piping covering the 4” to 60” rigid PVC pipe market sector. The pipe represented in this study is manufactured in the U.S. and Canada using a tin-based stabilizer. Rigid PVC pipe manufactured in North America does not contain phthalates, lead or cadmium. The completion of the North American PVC pipe industry LCA and publication of the PVC pipe EPD provide complete transparency on the life cycle impacts and benefits of PVC pipe. The purpose of this study is to provide a thorough review of the LCA data and to transparently report the findings of the PVC pipe LCA to the water, sanitary sewer and storm drain industries. The PVC pipe LCA and EPD support the goals and vision of the 2010 U.S. EPA Clean Water and Safe Drinking Water Infrastructure Sustainability Policy and the 2015 U.S. EPA National Water Program on Climate Change for ensuring the long-term sustainability of water infrastructure. This study also contains a comparative review of the corresponding competing pipe products based on publicly available information for the alternative pipe options. SUSTAINABLE SOLUTIONS CORPORATION
EXECUTIVE SUMMARY OVERVIEW This report on Life Cycle Assessment of PVC Water and Sewer Pipe and Comparative Sustainability Analysis of Pipe Materials includes: X Thorough examination of a PVC pipe Life Cycle Assessment (LCA) for seven pipe products X Comparisons to other piping materials regarding performance and durability attributes X Additional sustainability topics BACKGROUND – PVC PIPE LIFE CYCLE ASSESSMENT (LCA) The Uni-Bell PVC Pipe Association (PVCPA) commissioned an LCA on seven PVC pipe products in three market segments (potable water pressure pipe, sanitary sewer gravity pipe and storm drainage gravity pipe). Gravity piping included both solid-wall and profile-wall products. The goals of the LCA were to: X Determine “cradle-to-grave” energy-related impacts for the seven PVC pipes X Compare these results to publicly available information on competitive products The LCA was conducted by Sustainable Solutions Corporation (SSC), a firm specializing in life cycle assessment and sustainable product design and analysis. LCA TRANSPARENCY To ensure that the LCA would be transparent: X Methodology – the LCA was conducted in accordance with the life cycle assessment standards of the International Organization for Standardization (ISO): the ISO 14040 series. X Peer review – the LCA was critically reviewed by a panel of independent experts in the field of sustainability. The reviewers were: Rita Schenck (Institute for Environmental Research and Education), Nigel Howard (Clarity Environment) and Charlie He (Carollo Engineers).
LCA KEY FINDINGS The LCA found that PVC has lower life cycle impacts in most categories than alternative materials analyzed. Areas studied included: X Raw material production and transportation X Pipe production, transportation and installation X Pipe use phase (including maintenance, repair and replacement) analyzed and reported separately X Pipe end-of-life phase Based on the results of the LCA and literature-based comparisons to competing piping materials, PVC pipe provides a competitive advantage for most piping applications. ADDITIONAL INFORMATION This report is intended to explain the LCA, the PVC pipe data generated and the comparisons made to other pipe materials. In addition, this study examines important topics that will help utilities to better assess the performance and suitability of different piping materials, such as: X Health and safety X Air and water quality X Monetary impacts of pipe leakage, internal corrosion and external corrosion
ACIDIFICATION POTENTIAL propensity of a chemical to form acidifying H+ ions which degrade the natural environment. BRITTLENESS having hardness and rigidity but little tensile strength. CRADLE-TO-GATE partial Life Cycle Assessment of a product from resource extraction (“cradle”) to the manufactured product at the factory (“gate”); transportation, installation, use, and disposal phases of the product are omitted. CRADLE-TO-GRAVE full Life Cycle Assessment of a product from resource extraction (“cradle”) through use and disposal phases (“grave”). CRADLE-TO-INSTALLATION partial Life Cycle Assessment of a product from resource extraction (“cradle”), production, transportation to site, and installation; use and disposal phases of the product are omitted. CUMULATIVE ENERGY DEMAND (CED) the sum of all energy sources drawn directly from the earth, such as natural gas, oil, coal, biomass, or hydropower energy used to produce a product; another term for embodied energy. DESIGN LIFE period of time during which the piping system is expected by its designers to operate within its specified parameters. ENVIRONMENTAL PRODUCT DECLARATION (EPD) an independently verified and registered document that communicates transparent and comparable information about the life-cycle environmental impact of products; also known as “Type III Environmental Declarations.” EMBODIED ENERGY the sum of all energy sources drawn directly from the earth, such as natural gas, oil, coal, biomass, or hydropower energy used to produce a product; another term for cumulative energy demand. EUTROPHICATION POTENTIAL relative measure of the levels of phosphorus and nitrogen compounds released to inland waters. FAILURE when a pipe does not perform its design function, either structurally or hydraulically (by excessive leakage or reduced flow capacity). FEEDSTOCK ENERGY potential energy of the raw material contained within the product. GLOBAL WARMING POTENTIAL relative measure of how much heat a greenhouse gas traps in the atmosphere. LIFE CYCLE a series of stages through which a product, process, or service passes during its lifetime. LIFE CYCLE ASSESSMENT (LCA) technique to identify the environmental impacts associated with a product, process, or service over its lifetime; in contrast, the LCC focuses on monetary costs. LIFE CYCLE COSTING (LCC) method to evaluate the monetary costs involved with a product, process, or service over its lifetime; in contrast, LCA focuses on environmental impacts. OZONE DEPLETION POTENTIAL relative amount of degradation to the Earth’s ozone layer that a chemical compound can cause. PHYSICAL LIFE time during which the pipe system can be used (not necessarily economically). PRODUCT CATEGORY RULE (PCR) set of specific requirements and guidelines for developing an Environmental Product Declaration (EPD). RECURRING EMBODIED ENERGY energy consumed to maintain, repair, restore, refurbish, or replace materials, components, or systems during the pipe’s use. SERVICE LIFE time during which a product, process, or service performs within its specified parameters, i.e., performance based. PHOTOCHEMICAL OZONE (“SMOG”) CREATION POTENTIAL relative contribution of a chemical compound to formation of ground-level ozone (“smog”) in an air space. STRAIN CREEP property of some pipe materials where pipe under a load will continue to slowly deflect over time.
TABLE OF CONTENTS FOREWORD EXECUTIVE SUMMARY GLOSSARY OF TERMS 1.0 Key Findings of the PVC Pipe LCA and Sustainability Review of Pipe Attributes � � � � � � � � � � � � � � � � � � 12 1.1 PVC Pipe’s LCA Meets ISO Standards and the PVC Pipe EPD Provides 8 Transparent Disclosure of the Environmental Impacts � � � � � � � � � � � � � � � � � � � � � � � � � � � � � � � � � � � � 12 1.2 Pipe Service Life Assumptions Are Critical in Life Cycle Analysis � � � � � � � � � � � � � � � � � � � � � � � � � � � � � � 13 1.3 Consistent Long-Term Water Quality Is a Critical Sustainability Requirement During the Life of the Pipe � � � � � � � � � � � 14 1.4 Manufacturing Is an Important Life Cycle Stage - Consider Pipe Materials that Utilize an Efficient Manufacturing Process with Minimal Emissions to the Environment � � � � � � � � � � � � � � � � � � � � 14 1.5 Pipe Material Transportation and Installation Have Significant Impact on Life Cycle Cost and Carbon Footprint � � � � � � � � 15 1.6 Energy Consumption for Pumping Causes a Significant Cost and Impact During the Life of the Piping System � � � � � � � � 15 1.7 Water Pumping Efficiency and Sewer Capacity Are Significant Cost Drivers for Municipalities Over Time � � � � � � � � � � � 16 1.8 End of Life Management Is an Important Life Cycle Consideration � � � � � � � � � � � � � � � � � � � � � � � � � � � � � � 16 1.9 Worldwide PVC Pipe LCAs Provide Similar Findings � � � � � � � � � � � � � � � � � � � � � � � � � � � � � � � � � � � � 17 2.0 Sustainable Water Infrastructure � � � � � � � � � � � � � � � � � � � � � � � � � � � � � � � � � � � � � � � � � � � 18 2.1 Background � � � � � � � � � � � � � � � � � � � � � � � � � � � � � � � � � � � � � � � � � � � � � � � � � � � � � � � � � 18 2.2 PVC Pipe in North America � � � � � � � � � � � � � � � � � � � � � � � � � � � � � � � � � � � � � � � � � � � � � � � � � 18 2.2.1 NSF/ANSI Standard 61 Certification Verifies No Vinyl Chloride Leaching from PVC Pipe � � � � � � � � � � � � � � � � � � � 19 2.2.2 PVC Pipe Longevity � � � � � � � � � � � � � � � � � � � � � � � � � � � � � � � � � � � � � � � � � � � � � � � � � � � � � 19 2.3 Redefining Sustainability and Water Quality � � � � � � � � � � � � � � � � � � � � � � � � � � � � � � � � � � � � � � � � � 19 2.3.1 Sustainable Pipe Characteristics � � � � � � � � � � � � � � � � � � � � � � � � � � � � � � � � � � � � � � � � � � � � � � 20 3.0 Introduction to Life Cycle Assessment (LCA) � � � � � � � � � � � � � � � � � � � � � � � � � � � � � � � � � � � � � 21 3.1 Life Cycle Assessment Objectives � � � � � � � � � � � � � � � � � � � � � � � � � � � � � � � � � � � � � � � � � � � � � � 22 3.2 Key Aspects of the PVC Pipe LCA ISO Standards Methodology � � � � � � � � � � � � � � � � � � � � � � � � � � � � � � � 22 3.3 Independent Expert Review Panel � � � � � � � � � � � � � � � � � � � � � � � � � � � � � � � � � � � � � � � � � � � � � � 22
LIFE CYCLE ASSESSMENT OF PVC WATER AND SEWER PIPE AND COMPARATIVE SUSTAINABILITY ANALYSIS OF PIPE MATERIALS 3.4 Understanding Life Cycle Costing � � � � � � � � � � � � � � � � � � � � � � � � � � � � � � � � � � � � � � � � � � � � � � 23 3.5 Industry Recommended Functional Units of 100 Feet � � � � � � � � � � � � � � � � � � � � � � � � � � � � � � � � � � � � 23 3.6 Industry Coverage � � � � � � � � � � � � � � � � � � � � � � � � � � � � � � � � � � � � � � � � � � � � � � � � � � � � � 24 4.0 Life Cycle Impact Assessment � � � � � � � � � � � � � � � � � � � � � � � � � � � � � � � � � � � � � � � � � � � � � 25 4.1 TRACI Environmental Impact Definitions and Results � � � � � � � � � � � � � � � � � � � � � � � � � � � � � � � � � � � � 25 4.2 Cumulative Energy Demand (Embodied Energy) � � � � � � � � � � � � � � � � � � � � � � � � � � � � � � � � � � � � � � � 26 4.3 Greenhouse Gas Emissions (Global Warming Potential) and TRACI Environmental Impacts � � � � � � � � � � � � � � � � � 27 5.0 Pipe Cradle-To-Gate � � � � � � � � � � � � � � � � � � � � � � � � � � � � � � � � � � � � � � � � � � � � � � � � � � 30 5.1 Raw Materials Extraction and Production � � � � � � � � � � � � � � � � � � � � � � � � � � � � � � � � � � � � � � � � � � 30 5.1.1 Emissions Reporting � � � � � � � � � � � � � � � � � � � � � � � � � � � � � � � � � � � � � � � � � � � � � � � � � � � � 30 5.2 Pipe Production � � � � � � � � � � � � � � � � � � � � � � � � � � � � � � � � � � � � � � � � � � � � � � � � � � � � � � � 32 5.3 Recycled Materials � � � � � � � � � � � � � � � � � � � � � � � � � � � � � � � � � � � � � � � � � � � � � � � � � � � � � 33 9 6.0 Pipe Installation � � � � � � � � � � � � � � � � � � � � � � � � � � � � � � � � � � � � � � � � � � � � � � � � � � � � 34 6.1 Pipe Transportation � � � � � � � � � � � � � � � � � � � � � � � � � � � � � � � � � � � � � � � � � � � � � � � � � � � � � 34 6.2 Potential Environmental Impacts of Installing Pipe � � � � � � � � � � � � � � � � � � � � � � � � � � � � � � � � � � � � � � 34 7.0 PVC Pipe Use-Phase and Performance � � � � � � � � � � � � � � � � � � � � � � � � � � � � � � � � � � � � � � � � 36 7.1 Pipe Life with a 100-Year Benchmark � � � � � � � � � � � � � � � � � � � � � � � � � � � � � � � � � � � � � � � � � � � � 36 8.0 Review of Alternative Pipe Materials � � � � � � � � � � � � � � � � � � � � � � � � � � � � � � � � � � � � � � � � � 38 8.1 Research Methodology and Assumptions � � � � � � � � � � � � � � � � � � � � � � � � � � � � � � � � � � � � � � � � � � 38 8.2 Factors Impacting Pipe Service Life Analysis � � � � � � � � � � � � � � � � � � � � � � � � � � � � � � � � � � � � � � � � 38 8.3 Pipe Material Selections Used for Comparisons � � � � � � � � � � � � � � � � � � � � � � � � � � � � � � � � � � � � � � � 38 8.4 Service Life of Underground Pipes � � � � � � � � � � � � � � � � � � � � � � � � � � � � � � � � � � � � � � � � � � � � � 40 8.4.1 Service Life for Each Pipe Material � � � � � � � � � � � � � � � � � � � � � � � � � � � � � � � � � � � � � � � � � � � � � 41 8.4.2 PVC Pipe 100-Year Service Life � � � � � � � � � � � � � � � � � � � � � � � � � � � � � � � � � � � � � � � � � � � � � � � 42 8.5 Factors Influencing Service Lives of Water Pipes � � � � � � � � � � � � � � � � � � � � � � � � � � � � � � � � � � � � � � 42 8.5.1 External Corrosion � � � � � � � � � � � � � � � � � � � � � � � � � � � � � � � � � � � � � � � � � � � � � � � � � � � � � 42 8.5.2 Internal Corrosion � � � � � � � � � � � � � � � � � � � � � � � � � � � � � � � � � � � � � � � � � � � � � � � � � � � � � � 43 8.6 Corrosion Risk and Water Quality Issues � � � � � � � � � � � � � � � � � � � � � � � � � � � � � � � � � � � � � � � � � � 44 8.6.1 Corrosion of Cast Iron Pipes with Lead Joints: A Water Quality and Public Health Issue � � � � � � � � � � � � � � � � � � � 44 8.7 Internal Corrosion and Energy Loss � � � � � � � � � � � � � � � � � � � � � � � � � � � � � � � � � � � � � � � � � � � � � 44 8.7.1 Pipe Inside Diameters � � � � � � � � � � � � � � � � � � � � � � � � � � � � � � � � � � � � � � � � � � � � � � � � � � � � 44 8.7.2 Pipe Friction Factors � � � � � � � � � � � � � � � � � � � � � � � � � � � � � � � � � � � � � � � � � � � � � � � � � � � � 44
9.0 Environmental and Performance Attributes of Alternative Piping Materials � � � � � � � � � � � � � � � � � � � � � 48 9.1 Ductile Iron (DI) Pipe � � � � � � � � � � � � � � � � � � � � � � � � � � � � � � � � � � � � � � � � � � � � � � � � � � � � 48 9.1.1 Ductile Iron (DI) Pipe Service Life � � � � � � � � � � � � � � � � � � � � � � � � � � � � � � � � � � � � � � � � � � � � � � 48 9.1.2 Ductile Iron (DI) LCA and Embodied Energy � � � � � � � � � � � � � � � � � � � � � � � � � � � � � � � � � � � � � � � � � 49 9.1.3 Ductile Iron (DI) Pipe Use-Phase Performance � � � � � � � � � � � � � � � � � � � � � � � � � � � � � � � � � � � � � � � 50 9.2 Concrete Pipes � � � � � � � � � � � � � � � � � � � � � � � � � � � � � � � � � � � � � � � � � � � � � � � � � � � � � � � 51 9.2.1 Non-Reinforced Concrete Pipe (NRCP) Service Life � � � � � � � � � � � � � � � � � � � � � � � � � � � � � � � � � � � � � 51 9.2.2 Prestressed Concrete Cylinder Pipe (PCCP) Service Life � � � � � � � � � � � � � � � � � � � � � � � � � � � � � � � � � � � 52 9.2.3 Non-Reinforced Concrete Pipe (NRCP) Use-Phase Performance � � � � � � � � � � � � � � � � � � � � � � � � � � � � � � 52 9.2.4 Prestressed Concrete Cylinder Pipe (PCCP) Use-Phase Performance � � � � � � � � � � � � � � � � � � � � � � � � � � � � 52 9.3 Polyethylene and Polypropylene Pipes � � � � � � � � � � � � � � � � � � � � � � � � � � � � � � � � � � � � � � � � � � � � 53 9.3.1 Polyethylene (HDPE) Pipe Service Life � � � � � � � � � � � � � � � � � � � � � � � � � � � � � � � � � � � � � � � � � � � 53 9.3.2 Polyethylene (HDPE) Pipe Embodied Energy � � � � � � � � � � � � � � � � � � � � � � � � � � � � � � � � � � � � � � � � 54 9.3.3 Polyethylene (HDPE) Pipe Use-Phase Performance � � � � � � � � � � � � � � � � � � � � � � � � � � � � � � � � � � � � � 54 10 9.3.4 Polypropylene (PP) Pipe Service Life � � � � � � � � � � � � � � � � � � � � � � � � � � � � � � � � � � � � � � � � � � � � 54 9.3.5 Profile-Wall Polyethylene (HDPE) and Polypropylene (PP) Gravity Pipes Use-Phase Performance � � � � � � � � � � � � � � 54 9.4 Clay Pipes � � � � � � � � � � � � � � � � � � � � � � � � � � � � � � � � � � � � � � � � � � � � � � � � � � � � � � � � � 55 9.4.1 Vitrified Clay Pipe (VCP) Service Life � � � � � � � � � � � � � � � � � � � � � � � � � � � � � � � � � � � � � � � � � � � � 55 9.4.2 Vitrified Clay Pipe (VCP) Embodied Energy � � � � � � � � � � � � � � � � � � � � � � � � � � � � � � � � � � � � � � � � � 55 9.4.3 Vitrified Clay Pipe (VCP) Use-Phase Performance � � � � � � � � � � � � � � � � � � � � � � � � � � � � � � � � � � � � � � 56 9.5 Summary of Environmental and Performance Attributes of Alternative Piping Materials � � � � � � � � � � � � � � � � � � � 57 10.0 PVC Pipe Pumping Energy Savings � � � � � � � � � � � � � � � � � � � � � � � � � � � � � � � � � � � � � � � � � � 58 10.1 PVC Pipe Pumping Energy Cost Savings � � � � � � � � � � � � � � � � � � � � � � � � � � � � � � � � � � � � � � � � � � 58 10.2 PVC Pipe Low Monetized Carbon Footprint � � � � � � � � � � � � � � � � � � � � � � � � � � � � � � � � � � � � � � � � � 60 11.0 Sustainability Standards � � � � � � � � � � � � � � � � � � � � � � � � � � � � � � � � � � � � � � � � � � � � � � � � 62 11.1 Sustainable Infrastructure and Ratings � � � � � � � � � � � � � � � � � � � � � � � � � � � � � � � � � � � � � � � � � � � 62 11.1.1 Institute for Sustainable Infrastructure (ISI): EnvisionTM � � � � � � � � � � � � � � � � � � � � � � � � � � � � � � � � � � � 62 11.1.2 SMaRT Certification � � � � � � � � � � � � � � � � � � � � � � � � � � � � � � � � � � � � � � � � � � � � � � � � � � � � � 64 12.0 Summary Findings - Embodied Energy and Sustainability � � � � � � � � � � � � � � � � � � � � � � � � � � � � � � 65 12.1 Summary Findings for Total 100-Year Embodied Energy Comparisons for Pressure and Gravity Pipes � � � � � � � � � � � � 65 12.1.1 Pressure Pipe Total Embodied Energy Comparisons � � � � � � � � � � � � � � � � � � � � � � � � � � � � � � � � � � � � � 65 12.1.2 Gravity Pipe Total Embodied Energy Comparisons � � � � � � � � � � � � � � � � � � � � � � � � � � � � � � � � � � � � � � 68
LIFE CYCLE ASSESSMENT OF PVC WATER AND SEWER PIPE AND COMPARATIVE SUSTAINABILITY ANALYSIS OF PIPE MATERIALS 13.0 Conclusions � � � � � � � � � � � � � � � � � � � � � � � � � � � � � � � � � � � � � � � � � � � � � � � � � � � � � � 72 13.1 Summary of LCA Findings and Conclusions � � � � � � � � � � � � � � � � � � � � � � � � � � � � � � � � � � � � � � � � � 72 APPENDIX Pressure Pipe � � � � � � � � � � � � � � � � � � � � � � � � � � � � � � � � � � � � � � � � � � � � � � � � � � � � � � � � � � � � � 73 Main Breaks � � � � � � � � � � � � � � � � � � � � � � � � � � � � � � � � � � � � � � � � � � � � � � � � � � � � � � � � 73 Pressure Pipe Water Loss � � � � � � � � � � � � � � � � � � � � � � � � � � � � � � � � � � � � � � � � � � � � � � � � � � 74 Pressure Pipe: Hydraulic Energy Calculations � � � � � � � � � � � � � � � � � � � � � � � � � � � � � � � � � � � � � � � � 76 Pressure Pipe: Total Embodied Energy Calculations � � � � � � � � � � � � � � � � � � � � � � � � � � � � � � � � � � � � � 77 Gravity Pipe � � � � � � � � � � � � � � � � � � � � � � � � � � � � � � � � � � � � � � � � � � � � � � � � � � � � � � � � � � � � � 80 Gravity Pipe Total Embodied Energy Calculations � � � � � � � � � � � � � � � � � � � � � � � � � � � � � � � � � � � � � � 80 Infiltration Flows � � � � � � � � � � � � � � � � � � � � � � � � � � � � � � � � � � � � � � � � � � � � � � � � � � � � � � 84 Pipe Material Embodied Energy Summary � � � � � � � � � � � � � � � � � � � � � � � � � � � � � � � � � � � � � � � � � � � � � � 84 Pumping Energy Comparisons Over a 100-Year Life Cycle � � � � � � � � � � � � � � � � � � � � � � � � � � � � � � � � � � � � � � 85 11 Total 100-Year Pumping Energy: Costs Over Time Using Differing Pipe Service Lives � � � � � � � � � � � � � � � � � � � � 88 Life Cycle Cost Comparisons Over a 100-Year Life Cycle � � � � � � � � � � � � � � � � � � � � � � � � � � � � � � � � � � 90 Study of Water Main Cast Iron (CI) and Ductile Iron (DI) Pipe Failures � � � � � � � � � � � � � � � � � � � � � � � � � � � � � � � � � 90 Pit-Cast Iron � � � � � � � � � � � � � � � � � � � � � � � � � � � � � � � � � � � � � � � � � � � � � � � � � � � � � � � � 90 Gray Cast Iron � � � � � � � � � � � � � � � � � � � � � � � � � � � � � � � � � � � � � � � � � � � � � � � � � � � � � � � 90 Ductile Iron Service Life Is Less Than 50 Years � � � � � � � � � � � � � � � � � � � � � � � � � � � � � � � � � � � � � � � 90 Ductile Iron Has Thinner Pipe Walls � � � � � � � � � � � � � � � � � � � � � � � � � � � � � � � � � � � � � � � � � � � � � 91 Iron Pipe Corrosion, Leaching and Water Quality Risks � � � � � � � � � � � � � � � � � � � � � � � � � � � � � � � � � � � � � � � � 91 More Chemicals (Corrosion Inhibitors) Are Used in Drinking Water When Iron Pipes Are Used � � � � � � � � � � � � � � � � 91 Cement Lining Is a Potential Source of Heavy Metal Leaching � � � � � � � � � � � � � � � � � � � � � � � � � � � � � � � � 91 Iron and Manganese from Iron Piping � � � � � � � � � � � � � � � � � � � � � � � � � � � � � � � � � � � � � � � � � � � � 92 Pipe Selection Implications � � � � � � � � � � � � � � � � � � � � � � � � � � � � � � � � � � � � � � � � � � � � � � � � � 93 Iron Corrosion (Rusty/Red Water) Can Cause Lead Leaching in Water � � � � � � � � � � � � � � � � � � � � � � � � � � � � 93 Iron Corrosion (Rusty/Red Water) Can Deplete Water Disinfectants � � � � � � � � � � � � � � � � � � � � � � � � � � � � � 93 Health Impacts � � � � � � � � � � � � � � � � � � � � � � � � � � � � � � � � � � � � � � � � � � � � � � � � � � � � � � � 94 Iron Pipe Corrosion and Flint Water Quality Issues � � � � � � � � � � � � � � � � � � � � � � � � � � � � � � � � � � � � � � 94 Source Water pH Can Change � � � � � � � � � � � � � � � � � � � � � � � � � � � � � � � � � � � � � � � � � � � � � � � � 95 Sewer Pipe LCA Comparative Case Study � � � � � � � � � � � � � � � � � � � � � � � � � � � � � � � � � � � � � � � � � � � � � � � 95 REFERENCES
1.0 KEY FINDINGS OF THE PVC PIPE LCA AND SUSTAINABILITY REVIEW OF PIPE ATTRIBUTES The Life Cycle Assessment of PVC Water and Sewer Pipe and Comparative Sustainability Analysis of Pipe Materials study combines two major components of sustainability analysis. First, this study documents the cumulative embodied energy of PVC pipe for each of its life cycle stages from cradle-to-grave. This creates a common platform to both discuss and compare aspects of the product’s carbon footprint and its environmental impacts in scientific terms. PVC Pipe’s LCA Meets ISO Standards and the PVC Pipe EPD Provides Transparent Disclosure of the Environmental Impacts 1.1 X The PVC pipe LCA provides a comprehensive and transparent life cycle assessment and sustainability review to the North American water and sewer industry. 12 The second component takes into consideration the elements which can influence pipe performance and service level expectations. While manufacturers suggest a pipe life expectancy based on testing and manufacturing processes, utilities typically select a different service life in the installed environment. Service life is determined by design features, operational conditions, environmental conditions both inside and outside the pipe, and intended use. This study recognizes this fact and develops a performance-based service life for each pipe material. This performance-based service life in the installed environment focuses on the pipe’s ability to deliver a sustained level of high water quality in a cost-effective manner. In order to accomplish this, the major pipe materials and environmental and sustainability variables were considered. This includes an in-depth review of the two most common water pipe materials – PVC and ductile iron – as well as the specific attributes of other pipe materials. Sustainability, in terms of consistent water quality and delivery through underground pipe infrastructure, includes the variables of corrosion risk, climate impacts and energy costs. When determining a pipe material’s service life, a 100-year system design life is used. When all of these elements are combined, monetized costs can be applied to better compare the results. The following provides highlights of key findings of the overall study. X The PVC pipe LCA contains the required cradle-to-grave life cycle stages which include: Z Extraction and processing of raw materials Z Manufacturing Z Transportation and distribution Z Installation, use and maintenance Z Recycling and final disposal X By including the impacts throughout the product life cycle, the LCA provides a comprehensive view of the environmental aspects of the product and an accurate picture of the environmental tradeoffs in product selection. X Pipe life cycle assessments are based on a minimum 100-year design life benchmark due to the very long asset life of pipe infrastructure. X LCA is a more comprehensive and transparent analysis of the environmental impacts of a product throughout its life and is a much better indicator of environmental performance than single attribute claims like recycled content. Some materials, like metal, require large amounts of energy to recycle; and in the process emit additional toxic emissions compared to non- recycled primary metal production.
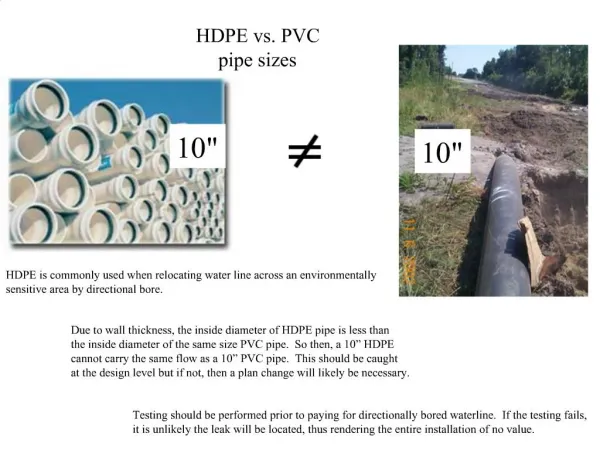
LIFE CYCLE ASSESSMENT OF PVC WATER AND SEWER PIPE AND COMPARATIVE SUSTAINABILITY ANALYSIS OF PIPE MATERIALS X X The Institute for Market Transformation to Sustainability’s SMaRT Certification for ductile iron and vitrified clay pipes (VCP) does not provide complete transparency for environmental certification. This study provides some examples of 50-, 75- and 100-year service lives to assist utility operators in understanding the modeling assumptions used in this study. X PVC pipe is assigned a 100-year service life based on 60 years of experience, extensive industry studies, dig-up field samples and historical data demonstrating low failure and water main break rates. Z No life cycle environmental information about the products is disclosed, preventing comparability with other pipe materials. Z Without transparent disclosure of environmental impact data, it is not clear if ductile iron pipe corrosion mitigation treatments such as cement lining and other additives to reduce corrosion are included in the analysis or certification of the pipe. X A study of exhumed PVC sewer pipe estimated its service life between 100 and 300 years. X PVC water pipe break rates reduce with time, whereas failures in corrosion-prone iron and concrete pipes increase over time, resulting in higher operating and maintenance costs. Z SMaRT Certification requires that dioxins are not produced during manufacturing; however, the manufacturing of ductile iron pipe produces dioxins. X Based on data from existing literature and industry pipe failure trends, ductile iron (DI) and high density polyethylene (HDPE) pipes with thinner walls are not expected to last for 100 years due to internal/external corrosion and oxidation/ strain creep, respectively. Pipe Service Life Assumptions Are Critical in Life Cycle Analysis 1.2 13 Z For instance, thicker-walled cast iron pipe is often cited as having a 75- to 100-year physical life, yet during a good portion of the time it is in use, the pipe’s performance may have significantly degraded because of internal and external corrosion and tuberculation, thereby impacting water quality and driving up pumping costs. Therefore, these pipes were operated inefficiently well past their service life. X When evaluating the sustainability of piping products for life cycle design, it is important to understand and evaluate the life cycle impacts of all materials used in the piping system. X This PVC pipe LCA study supports the efforts of asset management best practices and concepts that strive to reduce the life cycle costs of underground water, sewer and storm sewer assets while maintaining performance and reliable service levels, protecting water quality and minimizing water main breaks, water loss, infiltration and pavement repairs. X DI, like PVC, has been used for water and wastewater infrastructure for about 60 years. For this study, DI pipe is assigned a 50-year service life based on failure data of DI pipes and the fact that new ductile iron pipes have much thinner walls than older iron pipes and lack independent dig-up and pipe material testing studies. X Pipe manufacturers market various pipe materials with an estimated life. This “estimated” life does not represent the point at which pipe performance may begin to fail to meet intended service levels. X Metallic pipe systems require extensive condition assessment, corrosion surveys, corrosion protection systems and water quality testing. X This study considers the various literature and manufacturers’ estimated pipe life, but it also incorporates the practical evidence of industry pipe failure trends and dig-up studies to attribute a real-life pipe performance age to be used in the 100- year evaluation period. X Since there is very little data on the actual longevity and performance of newer HDPE pipe with thinner walls, a 50- year service life was assumed due to the potential for oxidation, strain creep and reduced Safety Factor. Z As an example, iron pipe has been used in water distribution systems for over 100 years. With up to an 80% water loss, the pipe’s practical service life expired decades before. When a pipe is operated beyond its service life, the results are: higher costs for water treatment and pumping, increased customer water bills, more property damage claims, and risk to both water quality for customer and trust for public officials.
Manufacturing Is an Important Life Cycle Stage – Consider Pipe Materials that Utilize an Efficient Manufacturing Process with Minimal Emissions to the Environment 1.4 Consistent Long-Term Water Quality Is a Critical Sustainability Requirement During the Life of the Pipe 1.3 X PVC pipe does not corrode from bacteria and biofilm and PVC pipe does not serve as a nutrient source for bacterial growth. X PVC pipe manufacturing is a very efficient process. It requires low inputs of energy and water, and scrap and rework materials (regrind) can be returned directly into the manufacturing process. This results in virtually no manufacturing waste. X PVC pipe will not degrade, corrode or leach when exposed to corrosive water, wastewater, sewer gases or disinfectants. X PVC pipe does not require chemical additives to prevent internal corrosion. X Only a small amount of energy is required for the extrusion of PVC pipe, so manufacturing is a small contributor to cradle-to- grave impacts. X PVC pipe does not have oxidation-induced premature failures. X The use of closed-loop water conservation technology has significantly reduced water consumption for the manufacturing of PVC pipe, demonstrating the industry’s commitment to continuous improvement and efficiency. X PVC pipe does not contain plasticizers such as DEHP or other phthalates. X PVC pipe does not contain lead. 14 X X PVC pipe does not contain BPA. Many pipe material production processes emit dioxins, such as manufacturing of ductile iron pipe, cast iron pipe for plumbing, concrete pipe and PVC resin. U.S. EPA data on dioxin emissions from PVC resin manufacturing show that dioxin levels are extremely low for PVC resin production and are continually being reduced. X PVC pipe does not leach vinyl chloride monomer. X Cast iron pipes have used molten lead as a pipe joint since the late 1800s. Any iron pipe water distribution systems older than 60 years most likely used lead to seal pipe joints. These iron pipes face severe corrosion issues, high water loss and can be a source of lead contamination to drinking water supplies. X U.S. EPA data show that dioxin emissions released from a ductile iron foundry were almost six times as high as a facility producing PVC resin. X Metallic and concrete pipes are always at risk and subject to internal and external corrosion. They require chemical additives (phosphates) in the drinking water to help reduce pipe wall corrosion. Phosphates increase the chances of bio- growth (such as algae blooms in extreme cases) in drinking water sources, lakes and rivers. X PVC pipe manufacturing facilities do not emit dioxins. X Ductile iron pipe manufacturing, which uses recycled metals, can release a host of additional chemicals such as lead, mercury, manganese, zinc, chromium compounds, trimethylamine, xylene, methanol and phenol in the process. X Corroded iron pipes cause rusty water events with an increase of iron ions. This can cause a water disinfectant to become ineffective, creating an increased risk of contamination. X Greenhouse gas (GHG) emissions are far higher for concrete than for PVC pipe. This clearly illustrates the need to evaluate all life cycle aspects when selecting piping materials. The cement industry is ranked as the third-largest GHG emitter in the world, releasing over 5% of the world’s carbon dioxide emissions. X The inside area of a ductile iron pipe from the beginning of the bell to the gasket is not coated with lining material so that portion of each joint of installed DI pipe has potable water exposed to a surface not certified to NSF/ANSI 61. X The production of PVC pipe using virgin material is less energy- intensive than ductile iron pipe production using recycled materials, resulting in fewer environmental impacts for water infrastructure projects. X Studies demonstrate that cement-mortar linings used in ductile iron pipes may fail or degrade between 10 and 30 years due to structural issues and chemical leaching. This leaves potable water exposed to a pipe wall not certified to NSF/ANSI 61.
LIFE CYCLE ASSESSMENT OF PVC WATER AND SEWER PIPE AND COMPARATIVE SUSTAINABILITY ANALYSIS OF PIPE MATERIALS Pipe Material Transportation and Installation Have Significant Impact on Life Cycle Cost and Carbon Footprint Energy Consumption for Pumping Causes a Significant Cost and Impact During the Life of the Piping System 1.5 1.6 X X PVC pipe has a lower transportation carbon footprint per installed foot than ductile, concrete and clay pipes. A significant cost during the design life of a pressure pipe system is the energy required to pump the water. Using pipe materials that do not corrode reduces pumping energy and lowers the carbon footprint of the piping system over its design life. This study provides utility engineers with pumping energy costs for different pipe materials over a 100-year period. X PVC pipe is 25% of ductile iron’s weight per foot, which means PVC pipe can be transported with a lower carbon footprint compared to equivalent lengths of ductile iron pipe. X PVC pipe manufacturing facilities are found throughout the United States and Canada which reduces transportation costs and environmental impacts. X Municipal water treatment and delivery systems require a significant amount of energy to move water. Water and wastewater utilities often represent as much as 40% of a municipality’s total energy consumption. X The light weight and durability of PVC pipe can reduce installation costs and environmental impacts as well as greenhouse gas emissions. Lighter-duty equipment and smaller crew sizes can be used with PVC pipe installation compared to other pipe materials. X The energy required to pump water through a pressurized pipe system over the life of the pipe is a significant source of potential environmental impacts. 15 X More utilities and local governments are implementing strategies to reduce greenhouse gas emissions as part of their long-term goals. X PVC pipe eliminates traffic costs, related construction and environmental impacts as well as other lost revenue associated with pipe replacements over a 100-year design life. X Iron and concrete pipes are shown to not perform optimally for much of the time they are “in use,” since they are often plagued with water main breaks, water loss, water quality issues as well as high operating and maintenance costs due to corrosion. X PVC pipes can be installed with a 30% installation time savings over concrete pipes. X 8-inch ductile iron pipe produces nine times more carbon emissions during manufacturing, transportation and installation than equivalent PVC pipe. X Corrosive soils affect 75% of water utilities. The durability and corrosion resistance of a pipe greatly affect life cycle environmental impacts. Ductile iron pipe may last as little as 11-14 years in moderately corrosive soils, requiring numerous replacements over a 100-year period. This increases the embodied environmental energy impacts of iron pipe by up to nine times compared to PVC. X Pipe materials such as ductile iron, polypropylene, polyethylene, clay and concrete require additional costs and have increased environmental impacts due to the need to replace them at least once over a 100-year design life. X Reducing interior and exterior ductile iron pipe corrosion requires the addition of other materials such as a cement lining on the interior and a polyethylene encasement on the exterior. Cathodic protection systems are also used in water systems to help prevent corrosion in cast iron and ductile iron pipes. Incorrect or overuse of cathodic protection can corrode ductile iron pipes. The addition of other materials to prevent corrosion increases resource consumption, embodied energy and the carbon footprint of the product. PVC pipes do not require additional materials to address corrosion.
X X Corrosion reduces the Hazen-Williams flow coefficient and increases Manning’s n due to the roughening of the internal surface of the pipe. 66% of water supply pipes in the U.S. are 8-inches or smaller. Nationally, using PVC instead of ductile iron pipe could save $21 billion in pumping costs over a 100-year system design life. If PVC were used instead of HDPE pipe, $37 billion could be saved (2016 dollars). X Corrosion affects pumping efficiency significantly. Keeping pipes in use past their useful service lives results in higher operating and maintenance costs. Internal pipe wall degradation may begin almost immediately after ductile iron and concrete pipes are installed. X Pump stations for non-PVC pipes must be designed to have larger capacities with larger electrical supply power lines due to increased internal pipe friction over time. These larger capacity pumping facilities require greater embodied energy to construct, operate and maintain over their design life. X The energy required to pump water through PVC pipe over a 100-year design life remains constant because PVC pipe walls are smooth and do not roughen over time. This generates overall life cycle cost savings and a lower carbon footprint compared to ductile iron and concrete pipes that require more pumping energy over time due to corrosion, leaks and internal degradation. X For equivalent 24-inch solid-wall sewer pipes on the same slope, PVC has 24% more capacity than DI pipe, 50% more capacity than clay pipe and 35% more capacity than non-reinforced concrete pipe (NRCP). X For equivalent 8-inch pipes, the primary pumping energy demand is up to 100% greater for HDPE than for PVC, and for DI is up to 54% greater than PVC. End of Life Management Is an Important Life Cycle Consideration 1.8 16 X The capital cost of a new PVC pipe can be nearly 23% less expensive than cleaning and re-lining existing ductile iron pipe. X PVC pipe can be recycled back into itself up to eight times without a reduction in mechanical properties. X PVC pipe has low embodied energy impacts as well as consistently smooth, non-corroding walls which helps utilities and local governments minimize the energy (and thus GHGs) required to operate water systems. X PVC pipe can be recycled into many products. PVC is an inert material and does not readily degrade, so when PVC pipe does reach the end of its service life it will have minimal environmental impacts if left in the ground. X Recycled content is only a single attribute and is far from a complete view of life cycle environmental impacts. Iron drain pipe was removed as a green alternative in GreenSpec® because of the “high embodied energy and pollution emissions from coking plants” used to produce the product. Water Pumping Efficiency and Sewer Capacity Are Significant Cost Drivers for Municipalities Over Time 1.7 X The largest single source of recycled metal for ductile iron pipe is discarded automobiles. This type of scrap is the most difficult to use because the chemical composition is variable and can include mercury (a volatile air pollutant) and other toxins. X Polyethylene (HDPE) pipe has a much smaller internal diameter than either ductile iron or PVC pipe, significantly impacting its pumping efficiency over time. X Materials such as ductile iron (DI) and prestressed concrete cylinder pipe (PCCP) may have a larger initial internal diameter and a respectable friction factor when new, but pumping facilities are not designed based on the capacity of new pipes. The deterioration of the mortar-lining and corrosion of DI pipe requires greater pumping energy over the 100-year design life than for PVC. X PVC pipe is recyclable. However, since it is so durable, most of it has yet to enter the recycling stream. X Ductile iron and prestressed concrete cylinder pressure pipe may experience a 30% or greater decrease in friction factor over their pipe lives. This means that older DI and PCCP pipelines can require 100% more pumping energy than new pipe.
LIFE CYCLE ASSESSMENT OF PVC WATER AND SEWER PIPE AND COMPARATIVE SUSTAINABILITY ANALYSIS OF PIPE MATERIALS Worldwide PVC Pipe LCAs Provide Similar Findings 1.9 X This study examined multiple publicly available LCA studies conducted around the world, and the results of those studies were consistent with the LCA results for PVC pipe. X PVC pipe has numerous sustainability attributes. International studies have identified benefits regarding PVC pipe’s environmental performance and sustainability over other materials. X An independent LCA on wastewater piping systems states that ductile iron has the maximum environmental impact and PVC has the minimum environmental impact. X Studies confirm that PVC pipe is a low initial cost option and provides long-term savings because of its superior pumping efficiency, corrosion resistance and longevity. 17 17
2.0 SUSTAINABLE WATER INFRASTRUCTURE In addition to the LCA findings, this study comprehensively analyzes the environmental impacts of PVC pipe based on current environmental practices across the piping industry and through comparative analyses. The results demonstrate that PVC pipe has significant environmental and economic attributes for long-lasting water and sewer systems. Background 2.1 In 2010, the U.S. Environmental Protection Agency (U.S. EPA) released the Clean Water and Safe Drinking Water Infrastructure Sustainability Policy which describes an overall vision and priority for ensuring the long-term sustainability of water infrastructure.1 The policy encourages utilities to enhance their existing planning processes to ensure that water infrastructure investments are cost- effective over the design life, are resource efficient, and support community goals. This policy includes analyzing a range of alternatives and other innovative approaches, based on full life cycle analysis, while facing the challenge of repairing and replacing the aging water infrastructure. 18 PVC Pipe in North America 2.2 PVC was discovered in the 1830s but not introduced as pipe in North America until 1951. Dr. P. Heilmayr, Ph.D., considered by many as one of the founding fathers of modern PVC extrusion, along with PVC historians Dr. J. Summers and A. Whitney, confirm that PVC pipe produced in 1952 for the U.S. Navy used tin stabilizers, which became the industry standard thereafter for both pipe and fittings. Lead as a stabilizer was rejected at the outset by the North American PVC pipe and fittings industry. In 1955 the American Society for Testing and Materials (ASTM) started developing plastic pipe standards. The National Sanitation Foundation (now known as NSF International) began certifying tin-stabilized PVC pipe for drinking water in 1956. In 2015, the EPA released the work plan for the National Water Program on Climate Change. The plan states, “In the face of a changing climate, resilient and adaptable drinking water, wastewater and storm water utilities need to ensure clean and safe water to protect the nation’s public health and environment by making smart investment decisions to improve the sustainability of their infrastructure and operations and the communities they serve, while reducing greenhouse gas emissions through greater energy efficiency.”2 The LCA, as well as this comprehensive review, was commissioned by the Uni-Bell PVC Pipe Association. This industry association represents the 4-inch through 60-inch rigid PVC pipe market in North America. Rigid PVC water and wastewater pipe, manufactured in the U.S. and Canada, does not use or contain phthalates, lead or cadmium. As a result, PVC pipe is recognized as a safe pipe product and beneficial to public health. This Life Cycle Assessment of PVC Water and Sewer Pipe and Comparative Sustainability Analysis of Pipe Materials focuses on the comprehensive review of the environmental impacts, benefits and sustainability of PVC pipe for both water and sewer infrastructure. Life cycle assessment (LCA) was chosen as the tool to transparently analyze, quantify and report the potential environmental impacts associated with PVC pipe along each stage in the life cycle. The LCA was peer reviewed and is the basis from which the PVC pipe industry Environmental Product Declaration (EPD) was developed and published through NSF International. The EPD, as validated by NSF International, states, “PVC pipe and fittings are resistant to chemicals generally found in water and sewer systems, preventing any leaching or releases to ground and surface water... No known chemicals are released internally into the water system. No known toxicity effects occur in the use of the product.”3 While this Life Cycle Assessment of PVC Water and Sewer Pipe and Comparative Sustainability Analysis of Pipe Materials is focused on PVC piping systems, this overall study includes publicly available life cycle information and a comparative review of the corresponding alternative pipe products. Comparability can be a challenge due to a lack of understanding of the materials and processes and the complexities involved in measuring the environmental and energy consumption impacts of pipes with different service lives.
LIFE CYCLE ASSESSMENT OF PVC WATER AND SEWER PIPE AND COMPARATIVE SUSTAINABILITY ANALYSIS OF PIPE MATERIALS Comparing LCA data is also difficult due to the inherent uncertainty and differences in parameters and data. PVC Pipe Longevity 2.2.2 The application of incorrect pipe characteristics, combined with a lack of PVC pipe system design knowledge, has understated the longevity of PVC pipe service lives. The American Water Works Association’s Buried No Longer report inaccurately published a PVC pipe service life based on 1960-1970s perceptions.7 Those perceptions have been disproven through extensive research, studies, and testing of PVC pipe life and performance.8 9 10 11 12 The actual life expectancy of PVC water and sewer pipe has been found to be in excess of 100 years. Inaccurate pipe performance and life expectancy can overstate water asset management pipe replacement costs.13 For water utilities with asset management programs, an inaccurate pipe life assumption will distort maintenance strategies, asset management plans and cost projections, resulting in overstated infrastructure replacement funding projections. This drives rate increases and a misalignment of long-term bond financing. NSF/ANSI Standard 61 Certification Verifies No Vinyl Chloride Leaching from PVC Pipe 2.2.1 The EPA has found no instances of vinyl chloride leaching from gasketed PVC pipes manufactured in North America for water transmission and distribution in sizes 4 to 60 inches. According to a 2002 EPA study on permeation and leaching, some ungasketed (solvent cemented) PVC pipes less than 2 inches in diameter manufactured in the U.S. prior to 1977 experienced vinyl chloride leaching. However, no instances of vinyl chloride leaching from any North American PVC pipe manufactured post-1977 have ever been cited.4 It is important to understand what vinyl chloride leaching means and how it is regulated. U.S. states require public water supply products in contact with drinking water to be certified to NSF/ANSI 61 Drinking Water System Components - Health Effects. The standard was developed to measure and limit levels of chemical contaminants and impurities that are indirectly imparted to drinking water from products, components and materials used in drinking water systems. This standard sets a limit for the amount of residual vinyl chloride contained in PVC pipe and fittings and ensures all drinking water health and safety requirements are met. However, monitoring for vinyl chloride in water systems can be challenging since studies have shown that vinyl chloride can be a disinfection byproduct from chlorinated treatment systems.5 19 Redefining Sustainability and Water Quality 2.3 This comprehensive sustainability review sets a new benchmark standard with both clarity and transparency for U.S. and Canadian water, wastewater and stormwater pipe manufacturers, utility engineers and elected officials. It also redefines sustainability planning for underground pipe infrastructure. Sustainability is the ability to maintain a certain level of performance, a resource or an operation for the long term. Sustainability includes an evaluation and focus on economic, environmental and social performance for an organization or a product. By considering the social and environmental features of a product, in addition to its financial and economic aspects, a balance can be met. Sustainability concerns are increasing as more than 50% of U.S. municipal water and wastewater infrastructure is nearing the end of its service life. According to a 2002 congressional study, corrosion costs U.S. water and wastewater systems over $50.7 billion annually. Since January 2000, the financial impact of corrosion on U.S. water and sewer infrastructure is more than $700 billion and climbing.14 With over 300,000 water main breaks per year over the next ten years, municipal utilities have set the stage for over $532 billion in capital improvements to address deteriorating piping networks, sewer overflows and rising population demands for new water supplies.15 NSF/ANSI 61 requires residual vinyl chloride monomer (RVCM) measured in PVC pipe that is sold and installed in the U.S. to consistently be below 0.2 parts per billion, which is one-tenth of the EPA’s allowable level for drinking water. Modern PVC pipe consistently tests “Non-Detect” for vinyl chloride monomer.6 NSF International led the development of the American national standards for all materials and products that treat or come in contact with drinking water. In 1990, the EPA replaced its own drinking water product advisory program with the NSF International standards.
Sustainable Pipe Characteristics 2.3.1 A sustainable piping product should have the following characteristics: X Low initial and operating costs X Longevity, with a service life of at least 100 years X Low pumping energy over the lifetime X Corrosion resistance (no additional materials or costs required) X Low maintenance X Low embodied energy X Minimum waste during manufacturing X Sustainable manufacturing practices X Minimal installation costs X Minimal transportation impacts X Recyclability at end of life X Consistent high water quality without chemical additives X No infiltration or exfiltration Sustainability concerns are increasing as more than 50% of U.S. municipal water and wastewater infrastructure is nearing the end of its service life. 20 PVC pipe meets the sustainable pipe characteristics listed above, and performance and durability is additionally ensured by the characteristics listed below. The PVC pipe industry has also transparently disclosed its environmental impacts in this report and through NSF International’s Certified Environmental Product Declaration. PVC’s sustainability is also attributed to: X Corrosion and chemical resistance without the need for additional protective coatings, liners or attachments X Lighter-weight (compared to other materials) and ease of transport X High strength-to-weight ratio X Low modulus of elasticity which reduces the magnitude of pressure surges X Long-term tensile strength over other thermoplastic pipes X Watertight joints eliminating leaks or infiltration X Outstanding resistance to external and internal abrasion X High impact strength even in low temperatures X Flame resistance X Superior flow coefficients, which contribute to low costs for operations and maintenance over its design life16
LIFE CYCLE ASSESSMENT OF PVC WATER AND SEWER PIPE AND COMPARATIVE SUSTAINABILITY ANALYSIS OF PIPE MATERIALS 3.0 INTRODUCTION TO LIFE CYCLE ASSESSMENT (LCA) Life cycle assessment is a tool used to identify the environmental impacts of a product, process or activity over its entire lifespan. LCA studies also quantify and interpret the environmental flows to and from the environment (including emissions to air, water and land, as well as the consumption of energy and other material resources) over the entire life cycle of a product (or process or service).17 FIGURE 3.1 : LIFE CYCLE OF PVC PIPE 01 Typical cradle-to-grave life cycle stages, as shown in Figure 3.1, include: 01 : Extraction and processing of raw materials 02 : Manufacturing 03 : Transportation and distribution 04 : Installation, use and maintenance 05 : Recycling and final disposal 21 05 02 04 By including the impacts throughout the product life cycle, the LCA provides a comprehensive view of the environmental aspects of the product and an accurate picture of the true environmental tradeoffs in product selection. 03 The LCA study examined seven PVC piping products from raw materials extraction through final disposal. The use phase was analyzed separately. The piping products are described in Table 3.1. TABLE 3.1 : PVC PIPE PRODUCTS UNDER THE SCOPE OF THE LCA Dimension Ratio/ Pipe Stiffness Average Weight* (lb./ft.) Application Standard Nominal Diameter AWWA C900 8" DR18 9.1 Potable Water AWWA C900 8" DR25 6.7 AWWA C905** 24" DR25 55.9 ASTM F794 AASHTO M304 24" Profile Wall PS46 19.2 Storm Water ASTM F794 8" Profile Wall PS46 2.5 Sanitary Sewer ASTM D3034 8" Solid Wall PS46 4.3 ASTM F679 24" Solid Wall PS46 38.7 *Weights based on manufacturers’ literature and pipe standards. **Effective August 2016 the provisions of the AWWA C905 standard have been replaced and included in the AWWA C900 standard.
There are various methods globally for categorizing and characterizing the life cycle impact of the flows to and from the environment which can somewhat complicate the comparability of different LCA studies. Other variables in LCA include the system boundary (how far upstream, downstream and side-stream does the analysis go), the functional unit (what is the volume/mass/purpose of the object being assessed), and specific LCA methods such as allocation (how are impacts assigned to the product, by-products, and on what basis). When comparing two LCA studies, these factors are critical in order to interpret the analysis. Key Aspects of the PVC Pipe LCA ISO Standards Methodology 3.2 The North American PVC pipe LCA study was conducted according to the life cycle inventory (LCI) and life cycle impact assessment (LCIA) standards as referenced in Section 3.1 established by the International Organization for Standardization (ISO) life cycle assessment standards ISO 14040 series. Key aspects of the study include: The PVC pipe EPD and LCA for the North American PVC pipe industry provides complete transparency on the life cycle impacts and benefits of PVC pipe. The manufacturing and installation of PVC pipe is completed per ASTM International (formerly American Society for Testing and Materials), AWWA (American Water Works Association), AASHTO (American Association of State Highway and Transportation Officials), CSA (Canadian Standards Association) and NSF International standards and certifications. This ensures that PVC pipe products meet the highest standards for quality and safety. X The results of the LCA study have been published in an environmental product declaration which complies with ISO 14025 standards and was independently verified by NSF International according to the requirements set forth by the Product Category Rule for Piping Systems for Use for Sewage and Storm Water (Under Gravity) addendum for North America, which includes potable water piping systems per version 2 of the addendum.18 22 X The study was peer reviewed by a panel of independent industry and LCA experts to confirm conformance with international LCA standards. The results of the LCA are presented in this study. Additionally, these results can be found in the PVC pipe industry EPD published through NSF International. An EPD is considered a Type III environmental declaration, which provides LCA data in a standardized way, allowing the reader to compare the environmental performance of products on a life cycle basis. An EPD is based on a Product Category Rule (PCR), which is a set of specific rules, requirements and guidelines for Type III declarations. Before an EPD is published, the PCR and LCA undergo a review by a third party. The EPD is also independently verified and published through a program operator. X The PVC pipe LCA offers comprehensive environmental transparency from cradle-to-grave, resulting in the first industry-wide study in the North American pipe industry to provide an ISO 14025 compliant EPD. X The published EPD complements existing testing and certifications of PVC pipe from NSF International, substantiating no toxic or adverse health effects to drinking water from PVC pipe.19 Life Cycle Assessment Objectives 3.1 Independent Expert Review Panel 3.3 The objectives of the PVC pipe life cycle assessment were to: The LCA analysis for PVC pipe was subject to critical review from an international panel of experts on life cycle assessment. The EPD published used the results from this critically reviewed LCA. The review panel consisted of: X Quantify environmental impact results using the life cycle assessment methodology following standards established by the International Organization for Standardization (ISO) 14040 series X Investigate each life cycle stage of a PVC pipe for the associated impacts X Review use of modern technology on PVC pipe production X Investigate use-phase characteristics and pipe performance X Investigate installation methodologies
LIFE CYCLE ASSESSMENT OF PVC WATER AND SEWER PIPE AND COMPARATIVE SUSTAINABILITY ANALYSIS OF PIPE MATERIALS Rita Schenck, Ph.D., LCACP (Chair) : Executive Director Institute for Environmental Research and Education (IERE) Understanding Life Cycle Costing 3.4 Global expert and Institute Executive Director, Dr. Rita Schenck brings her knowledge of LCA and the critical review process to this project. As a member of the committee that formed the original ISO 14000 series in the 1990s, she is fully versed in how these standards govern LCA and EPD. Rita Schenck founded the Institute of Environmental Research and Education (IERE) after working for many years as an environmental manager. Rita represented the U.S. in negotiating the ISO standards on LCA. She continues to work as an international expert in LCA, serving on the scientific committee for the LCA of foods conference, CILCA (the Latin American LCA conference), and as a speaker, reviewer and expert witness. LCA should not be confused with life cycle costing (LCC) analyses. LCC evaluates the monetary costs involved with a product or service, whereas LCA focuses on the potential environmental impacts of a product, system or service.20 The total life cycle cost of a project is not limited to the initial capital investment of the project. Additional costs are considered during the life of the project, including costs for operations, maintenance, replacement and end of life. Each aspect is considered for each design proposed for a project. The U.S. EPA, the U.S. Conference of Mayors and the American Water Works Association all recommend life cycle costing for project verification and selection and as part of a repair and replacement planning strategy. A tool has been developed by the Water Environment Research Foundation (WERF) for water utilities to help with a life cycle costing analysis.21 European studies have found that PVC pipe has the best total cost of ownership for drinking water networks. HDPE pipe is on average 9-12% more expensive, while ductile iron is 19-26% more expensive over a 50-year period compared to PVC pipe.22 Combining life cycle cost and environmental life cycle assessment analysis provides a strong and compelling enviro- economic decision making process. Nigel Howard, C.Chem. : Managing Director Clarity Environment Mr. Nigel Howard has an international reputation for his work, especially on LCA and the environmental rating of buildings. In his early career in the U.K. he worked for the Greater London Council’s Scientific Branch undertaking product assessments (including plastics) and investigating product failures (including pipework). He also completed the U.K. Environmental Profiles Project (consensus agreed methodology for 24 U.K. building product sectors) and pioneered the LCA-based Green Guide to Specification. He chaired the U.K. Government’s Department of Environment, Transport and Region’s Public Consultation Panel on PVC. He spent 5 years in the U.S. as VP and CTO for the U.S. Green Buildings Council (USGBC) where he contributed to the U.S. Life Cycle Inventory database project and managed the USGBC Technical and Scientific Advisory Committee investigating LCA and health risk implications of PVC products and alternatives. 23 Industry Recommended Functional Units of 100 Feet 3.5 The function of the studied PVC pipes is to carry potable water, storm water, or wastewater across a specified distance. This study uses a pipe system length of 100 feet, at specified and common diameters, to disclose the resulting environmental impacts. Gaskets and lubricant are required for the joints of installed integral-belled pipe, and thus are included in this analysis. The distance of 100 feet was determined based on the Product Category Rule addendum published by UL Environment for Environmental Product Declarations.23 The functional unit is particularly important, as different materials have different densities and wall thicknesses to perform an equivalent function of transporting fluids. Therefore, the 100-foot length of the pipe system is considered the most appropriate unit for the function. Charlie He, P.E. : Associate Vice President Carollo Engineers Mr. Charlie (Qun) He, an Associate Vice President and Principal Engineer with Carollo, has more than 12 years of experience in water and wastewater treatment, water quality data analysis, computer modeling, advanced analytical work, environmental chemistry, water resources, hydrology, water distribution, and wastewater collection and treatment. Mr. He is a LEED AP and has gained extensive exposure in the field of sustainability. He is an expert on green building design and its impacts on water quality. He has conducted life cycle environmental impact assessment, carbon emission accounting, participated in water and wastewater system optimization studies and energy efficiency analyses.
Industry Coverage 3.6 This study used data from 23 facilities of members of the Uni-Bell PVC Pipe Association (see Table 3.2 for participating companies), representing roughly 22% of all PVC pipe manufacturing plants in the United States and Canada (see Figure 3.2). Table 3.3 lists the number of manufacturing facilities that submitted primary data for each of the seven pipe types analyzed. FIGURE 3.2 : MAP OF PARTICIPATING PVC PIPE FACILITIES FOR LCA 24 TABLE 3.2 : PARTICIPATING PVC PIPE MANUFACTURERS TABLE 3.3 : PVC PIPE MANUFACTURING FACILITES WHICH SUBMITTED PRIMARY DATA Participating PVC Pipe Manufacturers Number of Facilities Participating Number of Facilities Standard / Size / Product Diamond Plastics Corp. 7 AWWA C900 / 8" / DR18 21 IPEX, Inc. 3 AWWA C900 / 8" / DR25 3 National Pipe & Plastics Corp. 1 AWWA C905 / 24" / DR25 11 North American Pipe Corp. 8 ASTM F794 / AASHTO M304 / 24" / PS46 3 North American Specialty Products 1 ASTM F794 / 8" / PS46 2 PipeLife Jet Stream, Inc. 1 ASTM D3034 / 8" / PS46 17 Royal Building Products 2 ASTM F679 / 24" / PS46 11
LIFE CYCLE ASSESSMENT OF PVC WATER AND SEWER PIPE AND COMPARATIVE SUSTAINABILITY ANALYSIS OF PIPE MATERIALS 4.0 LIFE CYCLE IMPACT ASSESSMENT The following information describes and illustrates the potential life cycle environmental impacts for PVC pipe and should be used in evaluating all pipe products and systems. The LCA results presented in this section focus on two products: 8-inch PVC DR25 PC165 AWWA C900 pressure pipe and 8-inch PVC PS46 SDR35 ASTM D3034 solid-wall sewer pipe, presented in 100-foot units for a 100- year design life. The impact category definitions include: 24 X Ozone Depletion Potential: The decline in ozone in the Earth’s stratosphere. The depletion of the ozone layer increases the amount of short wave ultraviolet B radiation (UVB) that reaches the Earth’s surface. UVB is generally accepted to be a contributing factor to skin cancer, cataracts and decreased crop yields. X “Smog” Photochemical Ozone Creation Potential: Ozone in the troposphere is a constituent of smog that is caused by a reaction between sunlight, nitrogen oxide and volatile organic compounds (VOCs). This is a known cause for respiratory health problems and damage to vegetation. X Acidification Potential: A process whereby pollutants are converted into acidic substances which degrade the natural environment. Common outcomes of this are acidified lakes and rivers, toxic metal leaching, forest damage and destruction of buildings. X Eutrophication Potential: An increase in the levels of nutrients released to the environment. A common outcome of this is high biological productivity that can lead to oxygen depletion, as well as significant impacts on water quality, affecting all forms of aquatic and plant life. X Global Warming Potential: Increase in the Earth’s average temperature, mostly through the release of greenhouse gases. Common outcomes are an increase in natural disasters and sea level rise. 25 Due to cost, the common practice for most utilities is to leave the pipes in the ground at the end of their service life instead of digging them up to recover materials. PVC pipes, due to the long-term life of the material, have not entered into the recycled waste stream. As a result the end of life impacts are considered negligible. Additionally, PVC pipe will remain as an inert material. The use-phase impacts for pressure water pipe, that is the energy consumed from the friction of the pipe walls as water is being pumped through, is considered separately. Therefore, the results presented in this section include: raw materials extraction and processing, raw material transportation to the pipe manufacturer, pipe manufacturing, packaging, distribution and installation. TRACI Environmental Impact Definitions and Results 4.1 Cumulative energy demand and greenhouse gas (GHG) emissions and additional environmental impact results were included in the study. The U.S. EPA environmental impact methodology and Tools for the Reduction and Assessment of Chemical and other Environmental Impacts (TRACI) were used. TRACI impact categories included are ozone depletion, smog, acidification, eutrophication, and GHG emissions or global warming potential (GWP). The extraction and processing of raw materials is the main driver of ozone depletion and greenhouse gas emissions, for both water and sewer pipe. However, installation is the driver of the remaining categories of smog, acidification and eutrophication. This report investigates these stages in more detail and discusses the initiatives the industry has and is taking to reduce these environmental impacts of PVC pipe.
The raw materials processing energy and feedstock energy are the main drivers of cumulative energy demand; however, the installation stage is also a large driver of CED. Cumulative Energy Demand (Embodied Energy) 4.2 Initial embodied energy is influenced by the raw material source, pipe product and the nature of the installation as shown in Figure 4.1. The use phase also consumes energy, but is shown separately in a later section. During the use phase, any recurring embodied energy (energy consumed to maintain, repair, restore, refurbish or replace materials, components or systems during the pipe’s use) should be taken into account. LCA studies not extending to the same design life of 100 years for pipe materials will miss the embodied energy and environmental impacts cost of rehabilitation and if necessary, during the specified time, the impacts required for pipe replacement. Cumulative energy demand (CED) is another term for embodied energy and is an important benchmark used for many products, including pipe. Cumulative energy demand is the sum of all energy sources drawn directly from the earth, such as natural gas, oil, coal, biomass or hydropower energy used to produce a product. Feedstock energy is the potential energy of the material contained within the product. This energy is often referred to as the (high or low) heating value or (net of gross) calorific value. For PVC pipe, the feedstock source is the natural gas used to make ethylene. Fuel energy is the energy released when fuel is burned to manufacture the product. Thus, unlike fuel energy, feedstock energy is not consumed in the process of fabricating the product and does not contribute to the creation of CO2 or other pollutants. The CED for piping systems is tabulated and summarized in Table 4.1. 26 TABLE 4.1 : OVERALL LIFE CYCLE CUMULATIVE ENERGY DEMAND FOR PVC PIPE (MJ/100’) 8” PS46 SDR35 D3034 Solid Wall Life Cycle Stage 8” DR25 PC165 C900 Raw Materials 1.5E+04 8.7E+03 Feedstock Energy 7.0E+03 4.1E+03 Raw Material Processing Energy 7.7E+03 4.6E+03 Raw Material Transportation 1.3E+02 1.1E+02 Pipe Manufacturing 9.7E+02 1.2E+03 Packaging 4.4E+01 4.2E+01 Cradle-to-Gate Total 1.6E+04 1.0E+04 Cradle-to-Gate Minus Feedstock Energy 8.9E+03 5.9E+03 Final Product Transportation 2.0E+02 1.0E+02 Installation 3.8E+03 3.7E+03 Total 2.0E+04 1.4E+04 Total, Minus Feedstock Energy 1.3E+04 9.8E+03
LIFE CYCLE ASSESSMENT OF PVC WATER AND SEWER PIPE AND COMPARATIVE SUSTAINABILITY ANALYSIS OF PIPE MATERIALS FIGURE 4.1 : OVERALL CRADLE-THRU-INSTALLATION LIFE CYCLE CUMULATIVE ENERGY DEMAND FOR THE VARIOUS LIFE CYCLE STAGES OF PVC PIPE (MJ/100’) 20,000 18,000 16,000 14,000 12,000 10,000 8,000 6,000 4,000 2,000 Cumulative Energy Demand (MJ/100’ of PVC Pipe) INSTALLATION FINAL PRODUCT TRANSPORTATION PACKAGING PIPE MANUFACTURING RAW MATERIAL TRANSPORTATION RAW MATERIALS PROCESSING ENERGY FEEDSTOCK ENERGY 0 8” DR25 PC165 C900 8” PS46 SDR35 D3034 Solid Wall 27 TABLE 4.2 : OVERALL CRADLE-THRU-INSTALLATION LIFE CYCLE GHG EMISSIONS IMPACT OF PVC PIPE (KG CO2 EQ PER 100’) Greenhouse Gas Emissions (Global Warming Potential) and TRACI Environmental Impacts 4.3 8” PS46 SDR35 D3034 Solid Wall 8” DR25 PC165 C900 Carbon dioxide and other GHGs are emitted whenever fossil fuels are burned. GHG emissions can also result from a number of other human activities including the methane released from landfills. These gases can trap heat close to the earth and contribute to global warming. In September 2013, the Intergovernmental Panel on Climate Change (IPCC) concluded that “it is extremely likely that human influence has been the dominant cause of the observed warming since the mid-20th century” with a 95% confidence interval.25 The GWP of an activity’s emission is calculated on the basis of the kilograms of carbon dioxide equivalents (CO2 eq). Life Cycle Stage Raw Materials 680 400 Raw Material Transportation 9 8 Pipe Manufacturing 77 73 Packaging 2 2 Final Product Transportation 15 8 Installation 178 250 Only a modest amount of energy is required for the extrusion of PVC pipe, so manufacturing is a small contributor towards GHG emissions in the cradle-through-installation analysis. Table 4.2 and Figure 4.2 show the GHG emissions for the various life cycle stages of PVC potable water and sewer pipes. Table 4.3 and Figure 4.3 show the TRACI environmental impacts for 8-inch PVC DR25 PC165 AWWA C900 PVC pressure pipe. See Table 4.4 and Figure 4.4 for the TRACI environmental impacts for 8-inch PVC PS46 SDR35 ASTM D3034 solid-wall sanitary sewer pipe. Total 960 740
FIGURE 4.2 : OVERALL CRADLE-THRU-INSTALLATION LIFE CYCLE GHG EMISSIONS IMPACT OF PVC PIPE (KG CO2 EQ PER 100') 1,000 900 800 700 600 500 400 300 200 100 GHG Emissions (kg CO2/100’ of PVC Pipe) For these two piping products, the raw materials stage is the main driver of impacts; however, the installation stage is also a large driver of GHG emissions. INSTALLATION FINAL PRODUCT TRANSPORTATION PACKAGING PIPE MANUFACTURING RAW MATERIAL TRANSPORTATION RAW MATERIALS 0 8” DR25 PC165 C900 8” PS46 SDR35 D3034 Solid Wall 28 FIGURE 4.3 : ENVIRONMENTAL IMPACTS OF 8” PVC DR25 PC165 C900 PRESSURE PIPE (TRACI IMPACT ASSESSMENT METHODOLOGY) 100% 90% 80% INSTALLATION FINAL PRODUCT TRANSPORTATION PACKAGING PIPE MANUFACTURING RAW MATERIAL TRANSPORTATION RAW MATERIALS 70% 60% 50% 40% 30% 20% 10% 0% Ozone Depletion GHG Emissions Smog Acidification Eutrophication
LIFE CYCLE ASSESSMENT OF PVC WATER AND SEWER PIPE AND COMPARATIVE SUSTAINABILITY ANALYSIS OF PIPE MATERIALS TABLE 4.3 : 8” PVC DR25 PC165 C900 PRESSURE PIPE ENVIRONMENTAL IMPACTS USING THE TRACI IMPACT METHODOLOGY Raw Materials Manufacturing Construction Impact Category Unit per 100 ft. Total Raw Material Extraction & Processing Final Product Transportation Raw Material Transportation Manufacturing Process Packaging Installation Ozone Depletion kg CFC-11 eq 3.9E-05 3.5E-10 9.6E-07 1.1E-07 5.7E-10 5.2E-06 4.6E-05 GHG Emissions kg CO2 eq 6.8E+02 9.3E+00 4.9E+01 1.9E+00 1.5E+01 2.5E+02 1.0E+03 Smog kg O3 eq 2.4E+01 5.1E+00 2.9E+00 1.3E-01 2.4E+00 8.5E+01 1.2E+02 Acidification mol H+ eq 1.3E+02 9.0E+00 2.0E+01 5.7E-01 5.0E+00 1.7E+02 3.3E+02 Eutrophication kg N eq 1.4E-01 9.6E-03 5.2E-02 1.5E-02 5.0E-03 3.8E-01 6.0E-01 TABLE 4.4 : 8” PVC PS46 SDR35 D3034 SOLID-WALL SANITARY SEWER PIPE ENVIRONMENTAL IMPACTS USING THE TRACI IMPACT METHODOLOGY Raw Materials Manufacturing Construction Impact Category Unit per 100 ft. Total Raw Material Extraction & Processing Raw Material Transportation Manufacturing Process Final Product Transportation Packaging Installation 29 Ozone Depletion kg CFC-11 eq 2.4E-05 3.0E-10 5.4E-07 1.0E-07 2.9E-10 5.2E-06 2.9E-05 kg CO2 eq 4.0E+02 7.8E+00 7.3E+01 1.7E+00 7.5E+00 2.5E+02 7.4E+02 GHG Emissions Smog kg O3 eq 1.5E+01 3.2E+00 4.5E+00 1.3E-01 1.2E+00 8.5E+01 1.1E+02 Acidification mol H+ eq 7.7E+01 5.7E+00 3.2E+01 5.4E-01 2.5E+00 1.7E+02 2.8E+02 Eutrophication kg N eq 1.1E-01 6.0E-03 3.6E-02 1.6E-02 2.5E-03 3.8E-01 5.4E-01 FIGURE 4.4 : 8” PVC PS46 SDR35 D3034 SOLID-WALL SANITARY SEWER PIPE ENVIRONMENTAL IMPACTS (TRACI IMPACT ASSESSMENT METHODOLOGY) 100% 90% 80% INSTALLATION FINAL PRODUCT TRANSPORTATION PACKAGING PIPE MANUFACTURING RAW MATERIAL TRANSPORTATION RAW MATERIALS 70% 60% 50% 40% 30% 20% 10% 0% Ozone Depletion GHG Emissions Smog Acidification Eutrophication
5.0 PIPE CRADLE-TO-GATE With the adoption of sustainable products and design improvements, the PVC resin industry has taken great strides in reducing emissions and environmental impacts during raw material extraction and processing of materials to produce PVC resin. As evidenced in this report, the raw materials and installation stages are the main drivers of potential environmental impacts for the cradle-through- installation life cycle stages of PVC pipe. This section goes deeper into the progress that has occurred in the upstream production of PVC resin for pipe production, as well as investigates the pipe production process. emissions has caused a reduction of the overall environmental impact of the raw materials stage of the life cycle. Rigid PVC pipe manufactured in the United States and Canada does not contain plasticizers, such as diethylhexyl phthalate (DEHP), BPA, or other phthalates. PVC pipe made in the U.S. and Canada also does not contain lead. The North American PVC pipe industry uses a tin-based heat stabilizer. Very small quantities of heat stabilizers are used in PVC products to facilitate processing at the high extrusion temperatures required during manufacturing. 30 Emissions Reporting 5.1.1 Raw Materials Extraction and Production 5.1 A similar downward trend to vinyl chloride emissions has also occurred in dioxin emissions over the years. Dioxin emissions from PVC resin are currently emitted at a rate of less than one part per trillion of PVC resin produced. The EPA Toxic Release Inventory and the Vinyl Institute report showed dioxin emissions have decreased 79% from 2000 to 2011.28 The production of PVC resin utilizes vinyl chloride monomer (VCM) which is produced from chlorine and ethylene. Chlorine is manufactured from salt, predominately through diaphragm/ membrane cell electrolysis. The use of this technology, compared to the previous mercury cell process, significantly reduces energy consumption, emissions and hazardous waste. In the United States and Canada, over 99% of PVC resin is produced from vinyl chloride monomer that is manufactured using diaphragm/membrane cell electrolysis.26 There have been concerns by some groups about dioxin emissions from PVC, however, PVC resin production is not the only industry that produces dioxins. The manufacturing processes of ductile iron, cast iron for plumbing, and concrete pipes also produce dioxins. Total PVC resin production for pipes is responsible for less than 0.09% of the total dioxin released into the environment in the United States as compared with diesel trucks (approx. 5%), heavy equipment (approx. 2%) and industrial wood burning (approx. 3%) which are each responsible for the production of more dioxin on an annual basis.29 PVC pipe made in the U.S. and Canada does not contain lead. Concerns regarding vinyl chloride come from airborne emissions during resin production, not from the manufacturing and use of PVC pipe. Airborne emissions during resin production have steadily decreased since 1987. According to the Vinyl Institute, PVC resin production has increased by 76% since 1987, but vinyl chloride emissions published using the U.S. Environmental Protection Agency Toxic Release Inventory (TRI) have declined by 75% in the same time period.27 Over the years, the reduction of vinyl chloride
LIFE CYCLE ASSESSMENT OF PVC WATER AND SEWER PIPE AND COMPARATIVE SUSTAINABILITY ANALYSIS OF PIPE MATERIALS FIGURE 5.1 : UNEP ESTIMATED DIOXIN EMISSIONS FACTORS FROM GIVEN PRODUCTION SOURCES PCDD/PCDF Emissions Factor (µg TEQ/tonne product) 0 2 4 6 8 10 12 Iron and Steel Making Dirty Iron/Steel Scrap Clean Scrap/Virgin Iron Clean Scrap, Low PCPP Emissions 10 3 0.1 Blast Furnaces Cement Shaft Kilns Old Wet Kilns Rotary Kilns Wet Kilns 0.01 5 5 6 0.05 EDC, EDC/VCM, EDC/VCM/PVC Low-End Technologies 5 31 Mid-Range High-End 0.5 0.05 According to the EPA and the United Nations Environment Programme (UNEP), metal sintering and magnesium production (both used in steel and iron production) and coal-fired electricity production are also major sources of dioxin emissions.30 31 32 UNEP has standard emissions factors for facilities that are major sources of dioxin emissions.33 A sample of these factors is shown in Figure 5.1. GreenSpec® has removed cast-iron drain pipe from their listings because of the high embodied energy and pollution emissions from coking plants.34 When selecting pipe materials it is important to use life cycle thinking and understand all the impacts of the materials, especially emissions during the manufacturing phase. Dioxin emissions from metal production are poorly characterized, in part because a large fraction of the emissions is fugitive; and thus, they do not co me out at a specific smoke stack where they can be measured.
FIGURE 5.2 : ANNUAL DIOXIN AIR EMISSIONS FROM A VCM PVC RESIN PLANT AND A DUCTILE IRON PIPE PLANT TO THE U.S. EPA TOXIC RELEASE INVENTORY Facility TRI Reported Dioxin Air Emissions 3.5 3.0 2.5 Dioxins (g/yr.) 2.0 1.5 1.0 0.5 0 2000 2001 2002 2003 2004 2005 2006 2007 2008 2009 2010 2011 Year Georgia Gulf VCM (PVC Resin) U.S. Pipe and Foundries - Bessemer Dioxin emissions are tracked by the U.S. EPA through the Toxic Release Inventory (TRI). TRI data are made publicly available. Figure 5.2 is a sampling of the dioxin air emissions reported by a VCM (PVC resin) manufacturer and a ductile iron manufacturer. 35 factors reporting for iron production can be understated. Moreover, it has been shown that secondary iron production using scrap iron emits even more pollutants than primary iron production. 32 “Metal recycling has the potential for higher levels of dioxin formation because the scrap metal usually contains paints, oils, coatings, plastics and other impurities that may provide both chlorine and carbon. In this case, dioxins can be generated during scrap pretreatment to remove these impurities or during metal refining in the furnaces (smelting). Dioxins may also originate from fuels combusted in the furnaces. In addition, casting operations involve melting and pouring the hot metal into molds. These high- temperature processes can also result in dioxin emissions, depending on the mold material. Dioxin emissions from metal production are poorly characterized, in part because a large fraction of the emissions is fugitive; and thus, they do not come out at a specific smoke stack where they can be measured.”41 As shown in Figure 5.2, the PVC resin facility reports less dioxin emission than the ductile iron plant. This illustration confirms that dioxin emission are also a concern for other piping materials. The U.S. EPA has developed regulations to control and reduce emissions of toxic air pollutants from iron foundries. The EPA’s regulations for iron and steel foundries were issued in April 2004 and the EPA claims the regulations have reduced particulate matter, total metal hazardous air pollutants (HAPs) comprised of cadmium, chromium, lead, manganese and nickel as well as organic HAPs including benzene, dioxin, formaldehyde, methanol, naphthalene and triethylamine. Health effects associated with exposure to these pollutants can include cancer and chronic or acute disorders of the respiratory, reproductive and central nervous systems.36 Many ductile iron facilities also report heavy metal emissions such as lead and mercury as well as a host of other toxic chemical emissions. The top five air emissions during ductile iron pipe production are triethylamine, xylene, methanol, phenol and ammonia which are created during the molding process of ductile iron. The slag and dust generated in the production process can also be contaminated with manganese, zinc, lead and chromium compounds.37 38 39 Pipe Production 5.2 PVC pipe manufacturing is a very efficient process. It requires low inputs of energy and water and has the ability to immediately return scrap materials directly into the manufacturing process as regrind. This results in virtually no manufacturing waste. Emissions reporting from the iron industry are based on emission factors from the AP-42 Compilation of Air Pollutant Emission Factors: Stationary Point and Area Sources.40 In the Dioxin Policy Project by the EPA, dioxins were noted in the processing of ores to obtain metals, including the secondary production of the recovery of metals from scrap. The American Foundry Society has noted that due to the poor quality of some stack testing protocols, emissions PVC resin and a few additives are mixed together and then extruded to make pipe of a specified diameter and wall thickness. The extruded pipe is next cooled with water. Cooling water is typically a closed-loop process, which saves millions of gallons of water each year per facility. The increased use of closed-loop water conservation
LIFE CYCLE ASSESSMENT OF PVC WATER AND SEWER PIPE AND COMPARATIVE SUSTAINABILITY ANALYSIS OF PIPE MATERIALS technology demonstrates the PVC pipe industry’s commitment to continuous improvement and efficiency. After the cooling process, pipes are cut into standard lengths with an electric saw, and one end of each pipe is put into a belling machine to achieve the bell shape. Every standard length of pipe used in municipal potable water systems is pressure-tested on the production line. The finished pipes are then arranged onto wood frames and strapped into place, loaded onto a truck or train car, and shipped to a distributor or job site. Almost all scrap material is ground and fed back into the extruder, resulting in very little waste. The manufacturing process uses small amounts of electricity and results in almost zero emissions. Figure 5.3 outlines the steps involved in the PVC pipe manufacturing process. injected with alloys such as magnesium.45 The molten iron is cast using the centrifugal casting method. The ductile iron pipe is cooled, annealed, and then undergoes finishing for its end-use application.46 Slag and dust are generated as waste. Energy consumption in an iron foundry is high: a ductile iron cupola uses an estimated 13.7 MJ per kilogram of ductile iron and a ductile iron induction process uses 29.2 MJ per kilogram of ductile iron.47 Old cast iron or ductile iron pipes are rarely recycled. Should any iron pipe installed prior to the 1950s be recycled, special care should be taken since they likely have lead joints. Lead-joint iron pipe should be removed from the ground and disposed of as a hazardous waste. FIGURE 5.3 : PROCESS FLOW DIAGRAM FOR PVC PIPE Recycled Materials 5.3 Raw Materials from Truck and Train Recyclability is one attribute to consider in an environmental analysis of a product. PVC pipe can be recycled back into PVC pipe. The ability to recycle material back into the same or equal value item is called a closed-loop product. Closed-loop recycling is often a way to reduce life cycle impacts and to conserve resources. During production, PVC pipe manufacturers can regrind manufacturing scrap and integrate it back into the product, which significantly reduces waste from the manufacturing operation. All pressure and non-pressure PVC pipes manufactured in North America are permitted to use internal regrind. Using internal regrind prevents significant volumes of waste going to landfills. 33 Compound Mixing and Storage Extrusion Cooling Tank Saw Hydrotesting (Pressure Pipe Only) Due to PVC pipes being installed in the ground, it is generally economically unfeasible to excavate at the pipe’s end of life for the purpose of recycling. Additionally, for all pipe materials, the energy required for excavation would counteract the benefits of recycling. However, PVC pipe excavated for other reasons (e.g. new construction) has a high recyclability potential and can be mechanically recycled back into a pipe product performing the same structural function as one made only from virgin material. Packaging Shipping Since original widespread introduction of PVC pipe in the 1960s, the PVC pipe industry has continued to innovate while improving manufacturing performance. The PVC pipe LCA used data from 2012 provided by PVC resin manufacturers to account for the most recent technology in use. By using this data, the LCA accurately reflects current PVC pipe production. There is ongoing research investigating the closed-loop life cycle of PVC pipe. In fact, a recent study shows that the mechanical properties of PVC pipe using 100% recycled content do not change even after eight cycles of grinding and extruding the same material.48 Recycled content, as a single attribute, is not always a relevant indicator of low environmental impacts. As an example, a relatively large amount of energy is required to process the recycled metals to manufacture ductile iron pipe. The production of PVC pipe using virgin material is less energy-intensive than ductile iron pipe production using recycled materials, resulting in fewer environmental impacts for water infrastructure projects. Typical manufacturing of ductile iron includes the use of scrap metals, alloying ingredients, sand, and bonding metals. The largest single source of recycled metal for ductile iron pipe is discarded automobiles. This type of scrap is the most difficult to use because the chemical composition is variable and can include mercury (a volatile air pollutant) and other toxins.42 43 If a cupola furnace is used in the ductile iron production process, coke and limestone are also needed for slagging.44 Scrap and recycled metal are melted and often
6.0 PIPE INSTALLATION As shown in the overall life cycle results, pipe installation is an important phase of potential environmental impacts for PVC pipe. Since installation is highly variable, the following will discuss many aspects and considerations of the installation phase of PVC pipe systems, notwithstanding the ease of installation. FIGURE 6.1 : CUMULATIVE ENERGY DEMAND FOR TRANSPORTATION 5,000 4,500 4,000 34 3,500 Pipe Transportation 6.1 CED (MJ/100 ft.) 3,000 2,500 The light weight of PVC pipe contributes to lower transportation environmental impacts (and costs) and enables easier pipe handling once it arrives at the job site (see Figure 6.1). 2,000 1,500 1,000 500 0 Potential Environmental Impacts of Installing Pipe 6.2 4 8 12 16 20 24 Pipe Size (in.) PVC Pipe Ductile Iron Installation of PVC pipe is assumed to be similar to installation of pipe made from other materials. Installation requires the excavation and refilling of a trench. The depth and time required to dig and refill a trench vary widely per region, soil type, climate, existing infrastructure, equipment operator, local convention and other factors – therefore, the actual installation time and effort are widely variable. For 8-inch pipe, the trench width should be at least 24 inches. For 24-inch pipe, the trench should be between 36 and 48 inches in width. Typically, an excavator is used to dig the trench and a small loader re-fills the trench. By using smaller equipment, greenhouse gas emissions and other environmental impact categories can be reduced. Since pipe installation time varies widely, a brief sensitivity analysis was performed on the cumulative energy demand of installing an 8-inch water pipe. Table 6.1 and Figure 6.2 list the values and show graphically the results of a sensitivity analysis of installation time for 100 feet of 8-inch pressure pipe. Reducing time for pipe installation is a key aspect that can be pursued in the overall life cycle design of the product. There are environmental impacts of installing pipe caused by the use of fossil fuels in the excavation equipment that emit greenhouse gases and other emissions. Additionally, mining for bedding materials and the resources required for roadway repairs contribute to environmental impacts at the installation phase. PVC pipe’s light weight (25% of ductile iron’s weight per foot) and durability can reduce installation impacts and costs since lighter-duty equipment can be used to handle the pipe and a smaller crew size is needed.
LIFE CYCLE ASSESSMENT OF PVC WATER AND SEWER PIPE AND COMPARATIVE SUSTAINABILITY ANALYSIS OF PIPE MATERIALS Traffic costs and lost revenue are the two leading costs for installation.49 Ultimately, to reduce these costs, the frequency of replacing and the need to install new piping infrastructure should be reduced. Therefore, by installing PVC pipe that is highly durable, maintains a low failure rate and is not subject to corrosion, the costs for installation and operation will be reduced when amortized over the course of a 100-year design life. Since PVC pipe does not require replacement during the 100-year design life, it eliminates traffic costs, related construction and environmental impacts as well as other lost revenue associated with pipe replacements. In an open- cut sewer pipe installation, PVC was installed 30% quicker than concrete pipe.50 When selecting pipe materials, designers need to consider installation and operational costs and related environmental impacts. TABLE 6.1 : SENSITIVITY ANALYSIS OF INSTALLATION TIME FOR 100’ OF 8” PRESSURE PIPE (CUMULATIVE ENERGY DEMAND METHODOLOGY - MJ PER 100’) 1.5 Hours (Baseline) 2 Hours 2.5 Hours 3 Hours 3.5 Hours 35 Excavator 2,100 2,800 3,500 4,200 4,900 Skid Steer 530 700 880 1,100 1,200 Disinfection 70 70 70 70 70 Bedding 1,100 1,100 1,100 1,100 1,100 Total 3,800 4,700 5,600 6,500 7,300 FIGURE 6.2 : SENSITIVITY ANALYSIS OF INSTALLATION TIME FOR 100’ OF 8” PRESSURE PIPE (CUMULATIVE ENERGY DEMAND METHODOLOGY - MJ PER 100’) 8,000 Demand of Installation Time (MJ/100') Sensitivity on Cumulative Energy 7,000 6,000 5,000 Excavator Skid Steer Disinfection Bedding 4,000 3,000 2,000 1,000 0 1 Hour 1.5 Hours (Baseline) 2 Hours 2.5 Hours 3 Hours 3.5 Hours
7.0 PVC PIPE USE-PHASE AND PERFORMANCE Underground water and sewer pipe infrastructure has a very long design life. The costs are significant to build these critical assets and are even greater if the pipe must be replaced during the system’s design life. The system design process should focus on a long-term sustainable service life of products. pressure loss over the pipe distance. This friction requires pumping power to overcome this pressure head loss, adding significant costs to a system. This study analyzed the environmental impacts of this pumping energy. The average U.S. electrical grid was used to model these environmental impacts over a 100-year design life. Table 7.1 and Figure 7.1 show the environmental impacts of the cradle-through-installation of 8-inch PVC DR25 pipe compared to the use-phase impacts for 100 years of pumping energy at a constant water flow of 336 gallons per minute (gpm), with a pump energy efficiency of 75%. The flow rate of 336 gpm is equal to a flow velocity of 2 feet per second (fps) in an 8-inch PVC DR25 pipe. Because water demand is based on volumetric flow rate, the same flow rate of 336 gpm was used for comparison of all the 8-inch PVC DR25 pipe alternatives. The same methodology was used for comparison of the 8-inch PVC DR18 and the 24-inch PVC DR25 pipe alternatives. 36 Pipe Life with a 100-Year Benchmark 7.1 The service life of PVC is expected to exceed 100 years.51 52 53 Based on over 60 years of field experience and laboratory testing, a 100-year service life is used for PVC in this study. The service life of a product is the time over which the product can be used economically. The new standard or goal of a sustainable service life for underground pipe infrastructure is considered to be 100 years. When determining a pipe’s service life, external and internal pipe performance measures and service levels must be taken into account. It is recommended that all future LCAs related to underground pipe materials use this 100-year benchmark. The use phase of the pipe life cycle dominates as the primary cause of environmental impacts of PVC pipe with the exception of smog which is primarily caused by production of electricity and burning of fuel in the pipe installation equipment and from raw materials extraction and production. In order to distribute potable water during its expected service life, water is pressurized and pumped through the pipe to be delivered to a destination at a specified volumetric flow rate. By traveling through the pipe, the water creates friction against the pipe walls causing
LIFE CYCLE ASSESSMENT OF PVC WATER AND SEWER PIPE AND COMPARATIVE SUSTAINABILITY ANALYSIS OF PIPE MATERIALS TABLE 7.1 : ENVIRONMENTAL IMPACTS OF THE USE PHASE OF 8” PVC DR25 PC165 C900 PIPE Unit per 100 ft. of Pipe Embodied Impact of Pipe 100-Year Use Phase Impact Category Ozone Depletion kg CFC-11 eq 4.6E-05 9.0E+03 GHG Emissions kg CO2 eq kg O3 eq mol H+ eq 1.0E+03 6.1E+03 1.2E+02 1.1E+00 Smog Acidification 3.3E+02 5.5E+02 Eutrophication kg N eq 6.0E-01 7.8E+01 Cumulative Energy Demand MJ 2.0E+04 1.3E+05 FIGURE 7.1 : ENVIRONMENTAL IMPACTS OF THE USE PHASE OF 8” PVC DR25 PC165 C900 PIPE VS. EMBODIED IMPACTS OF THE PIPE 100% 90% 80% 70% 60% 50% 40% 30% 20% 10% 0% 37 Ozone Depletion GHG Emissions Smog Acidification Eutrophication Cumulative Energy Demand Embodied Impact of Pipe 100-Year Use Phase
8.0 REVIEW OF ALTERNATIVE PIPE MATERIALS Actual pipe service lives that are less than 100 years increase embodied energy in the cradle-to-gate phase which includes manufacturing replacement pipe as well as additional energy for transportation and installation. Research Methodology and Assumptions 8.1 The purpose of this section is to state the assumptions and calculations supporting this study’s comparisons of pipe service life, pipe selections, energy calculations, cost calculations and conclusions which were developed to provide real-world insight based on the design, construction and operational experiences of pipe design engineers. 38 Due to the comprehensive nature of this study and the requirements of the pipe Product Category Rule, the design life used is 100 years. This was done in order to achieve a new benchmark standard for sustainability analysis and to take into consideration the many risks facing the delivery of potable water and collection of sanitary sewage and stormwater. Pipes can have service lives that range from 15 to over 100 years.54 Actual pipe service lives that are less than 100 years increase embodied energy in the cradle-to-gate phase which includes manufacturing replacement pipe as well as additional energy for transportation and installation. Pipe replacements during the 100-year design life also greatly increase the overall life cycle costs because of the debt service payments for the design, additional right-of-way, bond sale and construction costs associated with an additional project. Factors Impacting Pipe Service Life Analysis 8.2 The expected service life of each pipe material type is important in life cycle assessment as well as life cycle costing calculations. A limited study may only use a 50-year design life and have all pipes with the same duration assuming that the pipe would be replaced due to capacity issues. It may not take into consideration sustainable infrastructure decision-making issues encompassing reliability, durability and the need to maintain a constant service or performance level. Another component of determining a performance-based service life is to assign a value to the various pipe materials for comparison purposes, which includes going beyond manufacturers’ marketing claims and reviewing additional data and sources to better understand the expected service level of a pipe. Pipe Material Selections Used for Comparisons 8.3 The following products are considered to be comparable pipe material selections used by utilities when planning for new or replacement piping infrastructure. See Table 8.1 for comparable pressure pipe products and Table 8.2 for comparable gravity pipe products.
LIFE CYCLE ASSESSMENT OF PVC WATER AND SEWER PIPE AND COMPARATIVE SUSTAINABILITY ANALYSIS OF PIPE MATERIALS TABLE 8.1 : COMPARABLE PRESSURE PIPE PRODUCTS PVC Size and Product Comparable Products Standard 8” PVC DR18 AWWA C900 8” PVC DR18 PC235 C900 8” DI CL51 AWWA C151 8” HDPE 4710 DR9 AWWA C906 8” PVC DR25 AWWA C900 8” PVC DR25 PC165 C900 8” DI CL51 AWWA C151 8” HDPE 4710 DR13.5 AWWA C906 24” PVC DR25 AWWA C905 24” DI CL51 AWWA C151 24” PVC DR25 PC165 C905 24” HDPE 4710 DR13.5 AWWA C906 24” PCCP PC200 AWWA C301 Note: All ductile iron pressure pipes in this study are cement-lined per AWWA C104. As sustainability management is integrated with managing assets to the lowest financial and environmental costs, then a new performance-based service life can be determined. Service life is an important consideration in calculating life cycle costs in order to demonstrate the ability to manage assets at the lowest life cycle cost. These costs are included in projected repair and replacement strategies and in funding projections as published in an asset management plan. 39 TABLE 8.2 : COMPARABLE GRAVITY PIPE PRODUCTS PVC Size and Product Comparable Products Standard 8” PVC PS46 ASTM F794 8” PVC PS46 F794 Profile Wall 8” DI ASTM A746 24” PVC PS46 ASTM F794 24” PP PS46 ASTM F2736 24” PVC PS46 F794 Profile Wall 24” HDPE PS34 ASTM F2306 21” PVC PS46 ASTM F794 8” PVC PS46 ASTM D3034 8” PVC PS46 SDR35 D3034 Solid Wall 8” DI ASTM A746 8” VCP ASTM C700 24” PVC PS46 ASTM F679 24” DI ASTM A746 24” PVC PS46 F679 Solid Wall 24” VCP ASTM C700 24” NRCP ASTM C14 21” PVC PS46 ASTM F679 Note: All ductile iron sewer pipes in this study are double cement-lined per AWWA C104.
X Provide water service delivery over a 100-year period with minimal risk of degrading the water quality. Service Life of Underground Pipes 8.4 X Provide a consistent high level of water quality service delivery in a cost-effective manner without significantly raising the cost of operations, maintenance and repair over a 100-year period. Determining infrastructure service life is an important process in developing the maintenance management strategies applied to various assets. Service life determination is based on many factors including condition assessment, decay curves, computerized maintenance management systems (CMMS), GIS-centric work histories or hot spots, validated service levels and industry standards, as well as regional and local experience. Service life is an important consideration in calculating life cycle costs in order to demonstrate the ability to manage assets at the lowest life cycle cost. These costs are included in projected repair and replacement strategies and in funding projections as published in an asset management plan. A key element of this service life focuses on the energy requirement and pumping energy costs associated with the operations of a pipe system. The overall total cost of ownership includes the initial capital outlay, maintenance costs and the operational costs of a pipe system. Life cycle cost analysis is applied to compare various pipe selection alternatives. In this type of comparable analysis, the embodied energy and other social and environmental impacts can be evaluated while considering public health and financial risks. As this process matures, performance-based pipe selection can be added to the procurement process to ensure that the water ratepayers can benefit from the user defined requirements. Historically, piping system design focused on the capacity of the pipe. A pipe would fail based on the “end of capacity life” or at a point of failure of use “end of physical life.” An “end of service life” could be related to water leakage or pressure loss or some other evaluated compliance requirement or defined community service level. Early infrastructure asset management efforts were only focused on extending the service.55 Financial reporting requirements focused only on an “end of financial life” when the asset is fully depreciated. Asset management practices and technology have increased the utilities’ ability to better analyze the relationships between service levels, performance measures and the financial costs of managing assets.56 Thus, “end of economic life” is when an asset ceases to be the lowest cost alternative to satisfy a specified performance or service level. One consideration in determining pipe service life includes the application of the bathtub theory. The bathtub theory is a function of the probability of failure with time and can take into consideration pipe failure data and field samples.59 This theory, illustrated in Figure 8.1, recognizes that the water pipe may not be in perfect condition when placed and installed in the ground. Some defects and damage may have taken place during manufacturing, transportation and installation which ultimately lowers the overall quality of the product. Some causes of failure are improper design, poor quality control and manufacturing defects. The construction process may also have an effect on pipe failure; examples include failure due to transit, human error and poor workmanship. Careless or improper construction or installation processes may also lower the performance of the pipe. Throughout years of service, operation and maintenance will affect pipe performance through various failure causes such as mechanical, thermal, chemical, biological, external interferences, natural catastrophes, and inappropriate services and maintenance.60 40 As sustainability management is integrated with managing assets to the lowest financial and environmental costs, then a new service life can be determined. Water, wastewater and drainage engineers typically think of the term “performance-based” only applying to contracting, defined as “a results-oriented contracting method that focuses on the outputs, quality or outcomes…to the achievement of specific, measurable performance standards and requirements.”57 The traditional design approach has been very prescriptive in nature, which has resulted in a lack of insight into the consequences; this means that, at the design stage, there is a lack of understanding of in-service durability performance. A performance-based specification approach would require a careful and realistic assessment of the interrelation between design and durability along with future maintenance, repair and operational costs. The conceptual basis of a performance-based approach is to ensure that the required performance is maintained throughout the intended life along with the optimization of the incurred lifetime costs.58 In the case of underground water pipe infrastructure and for the purpose of determining a service life for this study, the user defined performance requirements of water pipe assets include: Best practices to extend the service life of underground assets include: correcting distribution system design flaws; reducing human error; and using pressure reducing valves, automated systems, and improved training. These system improvements are important considerations for all piping materials. Service life is an important consideration in calculating life cycle costs in order to demonstrate the ability to manage assets at the lowest life cycle cost.
LIFE CYCLE ASSESSMENT OF PVC WATER AND SEWER PIPE AND COMPARATIVE SUSTAINABILITY ANALYSIS OF PIPE MATERIALS FIGURE 8.1 : APPLYING THE “BATHTUB” THEORY TO DETERMINING PIPE SERVICE LIFE Decreasing Failure Rate Constant Failure Rate Increasing Failure Rate Early "Infant Mortality" Failure Observed Failure Rate Constant (Random) Failures Failure Rate Wear Out Failures One consideration in determining pipe service life includes the application of the bathtub theory. The bathtub theory is a function of the probability of failure with time and can take into consideration pipe failure data and field samples. Time 41 Another component of determining a service life is to assign a value to the various pipe materials for comparison purposes, which includes going beyond manufacturers’ marketing claims and reviewing additional sources to better understand the expected service level of a pipe. The combination of performance and service delivery are critical in order to assign a value.61 This takes into consideration when water main breaks begin to occur, water quality issues arise, or pipe degradation (internal and/or external) is a concern and needing attention. In these circumstances the pipe has effectively met its service life as a low cost managed asset and now its total life cycle cost or total cost of ownership will begin to drastically increase. TABLE 8.3 : SERVICE LIFE ASSUMPTIONS OF SELECTED PIPES FOR COMPARISON Pipe Lives Before Replacement for LCA Service Life (Years) Pipe Material Standard PVC AWWA C900 100 PVC AWWA C905 100 PVC ASTM D3034 100 PVC ASTM F679 100 PVC ASTM F794 100 DI AWWA C151 50 DI AWWA A746 50 Service Life for Each Pipe Material 8.4.1 HDPE AWWA C906 50 HDPE ASTM F2306 50 For the purposes of this 100-year modeling and evaluation of sustainable underground water infrastructure, the following pipe service lives have been assigned as shown in Table 8.3. PCCP AWWA C301 75 PP ASTM F2736 50 VCP ASTM C700 50 General Consideration for Assigning Pipe Lives: X Historical failure/replacement data X Average soil conditions in the U.S. X Pipe thickness X Corrosion rates X Brittleness X Water loss and infiltration NRCP ASTM C14 50 Refer to Section 9 for detailed discussion on assigned service lives.
PVC Pipe 100-Year Service Life Factors Influencing Service Lives of Water Pipes 8.4.2 8.5 PVC has a service life of over 100 years for water, wastewater, and storm water applications, because it is not subject to corrosion. PVC has over 60 years of successful in-service pipe performance. The May 2014 PVC Pipe Longevity Report: Affordability and the 100+ Year Benchmark Standard by Dr. S. Folkman examined the lives of PVC water and wastewater piping.62 The conclusions of this study were that the combination of research, field dig-ups, testing and analysis confirmed a 100+ year benchmark standard for PVC pipes. In Europe, dig ups and testing after 70 years of use confirm that PVC pipe will last in excess of 170 years.63 According to the article, Predicting the Residual Life of PVC Sewer Pipes by A.J. Whittle and J. Tennakoon, a study based on the testing of exhumed PVC sewer pipe, the additional life expectancy for the PVC sewer pipe studied is a minimum of about 100 years and a “best value” of almost 300 years.64 PVC sewer pipes that were also dug up and tested in Europe had similar results.65An Examination of Innovative Methods Used in the Inspection of Wastewater Systems, published by the Water Environment and Reuse Foundation (WERF) stated, “If a utility has primarily PVC pipes, it would be pointless to invest in an inspection system designed to measure the amount of wall loss due to corrosion.”66 Likewise, when a metallic pipe’s complete unit cost is used, the total price tag would increase for both the capital cost and the operations and maintenance expenditures when corrosion control program costs are added. Pipe selection will drive the cost either up or down for a local community.67 There are many factors which influence the actual life of underground water infrastructure. Corrosion, in its various forms, is the leading cause of pipe failure in North America, creating a host of corrosion- related issues which impact service delivery and water quality. Other factors include oxidation induced failures caused by disinfection products used in water systems, excessive infiltration or exfiltration due to corrosion or leaking joints, and loss of flow capacity or greater pumping costs due to increased friction in the pipe or buildup of biosolids/tuberculation inside the pipe. External Corrosion 8.5.1 42 Corrosion is the major risk and cause of water main breaks and pipe failures in the U.S. and needs to be considered when designing piping systems. The risk of various types of corrosion will always exist (climate change will only exacerbate this problem) and will always need to be monitored. Iron pipe corrosion will adversely impact water quality.68 According to Water Main Break Rates in the USA and Canada: A Comprehensive Study by Dr. S. Folkman, 75% of all utilities have corrosive soil conditions.69 The map in Figure 8.2 shows the potential for corrosion in the United States. FIGURE 8.2 : U.S. CORROSIVE SOILS MAP (CONUS POTENTIAL FOR STEEL CORROSION) Steel Corrosion Potential High Low Moderate
LIFE CYCLE ASSESSMENT OF PVC WATER AND SEWER PIPE AND COMPARATIVE SUSTAINABILITY ANALYSIS OF PIPE MATERIALS Leakage from water infrastructure results in approximately 2.2 trillion gallons of water loss each year.70 Most of this leakage is due to corroded and broken pipes. Corrosion and leakage increase pumping energy, can cause bacteria and other organisms to grow, and may result in the leaching of metals into the water supply. Studies estimate that PVC pipe has a life expectancy of over 100 years.71 One reason for this longevity is that PVC pipe is resistant to both internal and external corrosion. In high pH soils, metal pipes are likely to corrode and fail well before the manufacturers’ published life expectancy. Internal Corrosion 8.5.2 Corrosion from Wastewater Sources Corrosion not only occurs from the external surroundings of a pipe, but may also occur internally from sewage, wastewater or other fluids or gases inside the pipe. For example, wastewater and sewage “…contain significant levels of biological and organic materials, including many bacteria that remain active in the waste streams. From a corrosion point of view, the most important types of bacteria are those that metabolize sulfur compounds because this microbiological activity can produce acidic chemicals that are corrosive to concrete and steel or iron. Some bacteria also oxidize ferrous ions to ferric ions, which makes the local environment more corrosive to carbon steel.” 76 Ductile iron is most likely to fail between a 21 and 40-year period. Pits or holes from corrosion were identified as the largest cause of ductile iron pipe material failures. The service life of ductile iron pipe corresponds to impacts of low to moderate soil corrosion on unprotected pipe. Likewise, concrete pressure pipe also fails most commonly between 21 to 40 years, indicating that corrosive soils influence the service life of concrete as well. According to B. Cohen in Fixing America’s Crumbling Underground Water Infrastructure, the early thicker-walled ductile iron pipes were expected to last 50-75 years.72 However, a study of a utility in Wisconsin shows that 79% of DI pipes installed between 1953 and 1982 lasted only 25-50 years.73 The National Research Council (NRC) was requested by the U.S. Bureau of Reclamation to evaluate the reliability of ductile iron pipe with polyethylene encasement and cathodic protection for a 50-year service life. The NRC concluded: “the committee does not find that the studies of DIPRA confirm that DI pipe with PE can meet the expected reliability of over 50 years of service life.” 74 The most common way these microorganisms affect wastewater streams is by growing colonies, creating a local environment that is acidic enough to dissolve concrete and to corrode steel and ductile iron. Another important commercial problem, due to the action of Thiobacillus ferrooxidans in particular, is the formation of highly insoluble, ferric oxyhydroxide mounds that can clog steel or iron pipes. Gaseous hydrogen sulfide (H2S), the familiar “rotten egg” odor, is also formed, which acidifies surface moisture in headspaces of enclosed or covered structures, causing acidic corrosion of concrete or metal surfaces. H2S and oxygen combine to form polythionic acids – a weak form of sulfuric acid. 43 In soils where there is a potential for corrosion, metal pipes such as ductile iron will need frequent replacement. According to a 2011 study by the AWWA Water Research Foundation, ductile iron pipes with the thinnest walls (representing the majority of metallic pipes sold) in moderately corrosive soils have a life expectancy of only 11 to 14 years.75 If the same corrosion-prone pipe materials are used in high-risk soil and locations, and the pipe is replaced every 15 years over the course of 100 years, then the pipe would need to be replaced up to 7 times. This increases the embodied environmental impacts and the costs of the system commensurably by up to 7 times. The wastewater industry takes corrosion and public health issues very seriously. An independent industry survey on wastewater collection pipe materials that provide the highest public benefits once in service was conducted in 2010 and 2012 and published in the Trenchless Technologies Pipe Materials Guide (the Guide).77 The wastewater industry responded that longevity and service life were the most important factors in choosing pipe. Wastewater engineers consider pipe to not only be a transport medium but also an important public health barrier to possible contamination. Due to internal corrosive and caustic conditions, the Guide ranked PVC as the most commonly used pipe which achieves the longest service life over all other pipe materials including brick, clay, concrete, fiberglass, polymer concrete, polyethylene, cast iron, ductile iron and steel. PVC has been around for decades, and its non-corrosive material characteristics have made it widely accepted in the wastewater industry.78 Corrosion, in its various forms, is the leading cause of pipe failure in North America, creating a host of corrosion- related issues which impact service delivery and water quality.
Corrosion from Source Water Excessively high and low pH can be detrimental to water systems. High pH causes water pipes and water-using appliances to become encrusted with deposits, which reduce the effectiveness of the chlorine disinfection, thereby causing the need for additional chlorine. Low-pH water will corrode or dissolve metals and other substances.79 In general, water with a pH < 7 is considered acidic and a pH > 7 is considered basic. The EPA recommends that public water systems maintain pH levels between 6.5 and 8.5. “The negative chloride ions are corrosive, so when the high-chloride water is pumped through lead pipes (or iron and copper pipes joined together with lead solder), lead leaches into the water.”80 Pipe networks require constant water quality testing due to changes in temperature, degradation of cementitious and metal components in piping materials, pipe breaks, corrosion-control chemicals and disinfectant additives. Corrosion of Cast Iron Pipes with Lead Joints: A Water Quality and Public Health Issue 8.6.1 Historically, various kinds of pipe materials and joints have been used in the U.S. water industry. “Materials used to make and join distribution system piping have improved.”81 As seen in Figure 8.3, lead was the predominant pipe joint material for most types of cast iron piping and presents a significant water quality risk today. Lead was used as a joint material for cast iron pipe until the 1980s. Corrosion in metallic drinking water pipe systems will continually be a risk factor to public health. According to a report by the U.S. Conference of Mayors, lead-jointed iron water main pipes are one of the possible sources of lead contamination in the potable water supply of Flint, Michigan.82 Additional discussions on iron pipe corrosion and water quality issues can be found in the Appendix. Leakage from water infrastructure results in approximately 2.2 trillion gallons of water loss each year. Most of this leakage is due to corroded and broken pipes. 44 Internal Corrosion and Energy Loss 8.7 Pipe Inside Diameters 8.7.1 Corrosion Risk and Water Quality Issues 8.6 The pipe inside diameter dimension is critical in determining the hydraulic characteristics of pressure and gravity pipes. For the selected pipes used in the analyses in this study, the internal diameters were determined using pipe standards, dimensional tolerances allowed in standards, standard lining thickness and manufacturers’ literature. As underground water pipe infrastructure is extended beyond practical service life expectations, utilities must assess known hazards including lead in iron pipe joints, water main breaks, boil water notices, drinking water contamination, corrosion treatment errors, rusty water that create risks to public health, private property damage, increased maintenance costs, water loss, increased water bills and politically difficult, public mistrust issues. These are known factors and holding on to traditional business practices will continue to trouble the water industry by offering the same results where corrosion is a risk to the pipe material and quality of the drinking water. Climate change and other trends will continue to affect corrosion-prone pipe materials. The following findings and evidence presented in this study can help utility managers engage in more informative discussions to improve expectations with customers and public officials as it relates to their sustainable infrastructure and water quality planning and policy development. Pipe Friction Factors 8.7.2 Pipe friction factors were based on a literature search and compilation of data from 55 sources. For instance, a recent City of Detroit analysis shows that the pumping efficiency for ductile iron pipe continually declines with age and does not remain at factory specifications.83 The Western Virginia Water Authority (WVWA) arrived at similar conclusions in its analysis of ductile iron water pipe.84 Based on the compilation and review, the values for Hazen- Williams C factors used for pressure pipes and for the Manning’s n friction factors used for gravity pipes are summarized in Table 8.4. Research revealed documentation for deterioration rates for the friction factors, particularly for the Hazen-Williams C factor used for pressure pipes. These deterioration rates over time were incorporated into the hydraulic energy calculations for the various pipe material types.85
LIFE CYCLE ASSESSMENT OF PVC WATER AND SEWER PIPE AND COMPARATIVE SUSTAINABILITY ANALYSIS OF PIPE MATERIALS FIGURE 8.3 : TIMELINE OF PIPE TECHNOLOGY IN THE U.S. IN THE 20TH CENTURY Pipe Material Joint Type Internal Corrosion Protection External Corrosion Protection 1900 1910 1920 1930 1940 1950 1960 1970 1980 1990 2000 2010 Steel Welded None None Steel Welded Cement None Pit Cast Iron Lead None None Spun Cast Iron Lead None None Spun Cast Iron Lead Cement None Spun Cast Iron Leadite None None Spun Cast Iron Leadite Cement None Spun Cast Iron Rubber Cement None Ductile Iron Rubber Cement None Ductile Iron Rubber Cement PE Asbestos Cement Rubber None None 45 Rubber None None Reinforced Concrete Rubber None None Prestressed Concrete PVC Rubber None None Pipe Material Availability Periods of Material Availability and Use Extended Potential Lead Joint Leaching Periods in Iron Pipes Graph adapted from EPA sources86 TABLE 8.4 : PIPE FRICTION FACTORS USED Pipe Material Standards Hazen-Williams C Manning's n PVC C900, C905, F794, D3034, F679 155 - 150 0.009 DI C151, C104, A746 ≤ 140 0.013 HDPE C906, F2306 155 - 150 0.012 PP F2736 N/A 0.012 PCCP/NRCP C301, C14 ≤ 140 0.013 VCP C700 N/A 0.013
Designers of pump stations, water transmission pipelines and water distribution systems use a friction factor, normally Hazen-Williams C, which is representative of the weighted age for the system that they are designing. To demonstrate the environmental impacts caused by the roughening of the pipe surface, sample analyses were performed using accepted degradation rates of the Hazen-Williams coefficient for different piping materials. The coefficients were varied for the degradation over time from their new values to the lowest degraded value. Table 8.5 lists comparisons among the Hazen-Williams coefficients for newly installed pipe, 50-year life and 100-year life data points. Table 8.5 also lists the resulting energy loss for each of those milestones which add to the overall cost and environmental impacts of the system. Figure 8.4 shows graphically the effects of the increased friction loss over time on pumping energy. Figure 8.4 assumes a 100-year plus life for PVC, a 75-year life for PCCP, a 50- year life for HDPE pressure pipe and a 50-year life for ductile iron. Throughout the service life, the surface of the pipe may roughen, causing more frictional energy loss the pumps must overcome to transport potable water. Not all piping materials roughen to the same degree over time. PVC pipe does not corrode or roughen, thus maintaining the water system’s hydraulic properties close to the original installation design specifications. Corrosion impacts pumping efficiency and operating costs. Studies have documented that pumping efficiency continually declines with age as a pipe corrodes. 46 TABLE 8.5 : EFFECTS OF FRICTION FACTOR DETERIORATION ON HEAD LOSS FOR AN 8" POTABLE WATER PIPE ASSUMING CONSTANT FLOW Hazen-Williams Coefficients Frictional Energy Loss (kWh/100'/yr.) HDPE (DR13.5) Cement-Lined DI (350 psi) PVC (DR25) HDPE (DR13.5) Cement-Lined DI (350 psi) Life-Cycle Milestone PVC (DR25) Install 155 155 140 125 185 140 50 Years 150 150 110 130 195 225 100 Years 150 150 95 130 195 280 FIGURE 8.4 : ANNUAL PUMPING ENERGY COMPARISONS FOR 24" PIPES 700 Pumping Energy (kWh/100'/yr.) 600 PVC PC165 DI PC200 PCCP PC200 HDPE PC160 500 400 300 200 Note: Graph assumes replacement of DI pipe at 50 years, PCCP at 75 years and HDPE at 50 years. 100 0 0 10 20 30 40 50 60 70 80 90 Years
LIFE CYCLE ASSESSMENT OF PVC WATER AND SEWER PIPE AND COMPARATIVE SUSTAINABILITY ANALYSIS OF PIPE MATERIALS Since PVC pipe does not corrode as it ages, the smoothness of the internal pipe wall surface does not decrease. PVC pipe has a smooth surface which reduces frictional energy loss over the pipe’s life compared to metallic or concrete pipes. The Hazen-Williams coefficient (C factor) for new PVC pipe is 155-165 (the higher the value, the smoother the pipe).87 A flow coefficient of C = 150 is generally used as a conservative value for the design of PVC piping sytems.88 89 90 In contrast, new mortar-lined ductile iron pipes can have a C factor of 140 as claimed by the Ductile Iron Pipe Research Association (DIPRA). However, due to corrosion and deterioration of the lining material, the internal walls of iron pipes become significantly rougher over time, decreasing the C factor.91 To prevent corrosion and provide a pipe wall that is listed for contact with potable water, cement lining is added to ductile iron water pipes. Concrete pipes and cement-mortar lined metallic pipes’ C factors typically range from 120-140 for new pipe and 75-100 for older pipe as it degrades over time.92 Field samples of over 60 mortar-lined PVC pipe does not corrode or roughen, thus maintaining the water system’s hydraulic properties close to the original installation design specifications. ductile iron pipes from the WVWA demonstrates how the C factor decreases from 125 to 75 over a 55-year timeframe. The Washington Suburban Sanitary Commission (WSSC), which is the eighth largest water and wastewater utility in the U.S. and provides drinking water to 1.8 million people, provided 27 iron pipe field data samples which show a similar trend. See Figure 8.5.93 HDPE is also not subject to internal corrosion and has a smooth internal wall. A C factor of 150 is generally used for HDPE pressure pipe. 47 FIGURE 8.5 : FIELD SAMPLES SHOWING DECLINING C FACTOR FOR DI PIPE Utility Field Samples of Ductile Iron Pipe: Hazen-Williams C Factor 150 140 130 120 110 100 90 80 70 60 Hazen-Williams C Factor 0 5 10 15 20 25 30 35 40 45 50 55 60 65 Number of Years Installed
9.0 ENVIRONMENTAL AND PERFORMANCE ATTRIBUTES OF ALTERNATIVE PIPING MATERIALS While the ability to understand the environmental impacts of PVC pipe products is valuable in itself, some perspective can also be gained by seeing how the results of the LCA study compare to other published pipe LCA and performance studies.94 95 All of these studies were conducted by different practitioners with potentially different methodological considerations. The LCA and performance studies were reviewed for consistency in their conclusions. This section presents the results from these published and widely available studies. These studies may vary between system boundaries and assumptions. Initially, ductile iron was advertised as exceeding the corrosion resistance of gray cast iron. This idea gained acceptance in the marketplace and allowed thinner-walled ductile iron pipe to replace thicker-walled cast iron pipe. However, research provides evidence of corrosion being consistent among iron pipe types: X Research by the National Bureau of Standards (now the National Institute of Standards and Technology) indicated decades ago that ductile iron, cast iron and steel corrode at similar rates in low-resistivity soils.101 48 X National Bureau of Standards testing concluded in a 1976 article that ductile iron and steel “buried in the same soils… corrode at nearly the same rates.”102 Ductile Iron (DI) Pipe 9.1 X The Ductile Iron Pipe Research Association (DIPRA) acknowledges that, for practical purposes, ductile iron and cast iron can be considered to corrode at the same rate.103 However, DIPRA has not adjusted the marketplace expectation based on a 76% reduction in pipe wall thickness. Ductile iron pipe has been a widely used material in water pipe systems throughout the U.S. and Canada. However, according to a report by the National Taxpayers Union, ductile iron pipe longevity has plummeted because of its thinner walls and greater susceptibility to corrosion compared to older iron piping.96 Ductile iron pipe is now rarely used in Canada and the downward trend in its use in the U.S. is well known. The thinner wall of ductile iron pipe is the main factor that contributes to its shorter service life compared to cast iron and the increase in corrosion-related water main failures.104 Historically, the extra thickness of the cast iron pipe provided more metal for corrosion to attack (i.e., a corrosion allowance). As shown in Figure 9.1, the historical wall thickness difference can be as much as 76% thinner for a similar pressure class and diameter pipe.105 If the wall thickness of ductile iron pipe is only one-fifth of the cast iron wall thickness and the corrosion rate is the same, then its expected life will be substantially less than for cast iron in similar environments. The walls of iron pipe were reduced from 1.58 inches in 1908 to 0.38 inches by 1991. New proposed reductions would thin the pipe wall to 0.21 inches. The difference in wall thickness is one consideration that must be taken into account during corrosion evaluations and selection of control methods. Some utilities are specifying increased ductile iron thickness classes for additional wall thickness (resulting in higher embodied energy and capital costs) in an attempt to provide a greater corrosion allowance. The simple fact is that thinner metallic pipes, under similar soil and moisture conditions, corrode and fail more quickly than their thicker cast iron predecessors.106 Thick cast iron pipes took a longer time to corrode through the pipe wall than Ductile Iron (DI) Pipe Service Life 9.1.1 Over time, ductile iron pipes have been made with progressively thinner walls, making corrosion a major risk that will always exist.97 Studies have demonstrated the failure of cement-mortar linings (structural and chemical-leaching) between 10 and 30 years. These failures have an impact on the expected service life.98 99 The increased use of recycled materials can lead to accelerated corrosion because of inferior quality material that can be contained in recycled scrap iron. All of the factors that lead to the deterioration of ductile iron pipe can reduce its service life to less than 50 years.100
LIFE CYCLE ASSESSMENT OF PVC WATER AND SEWER PIPE AND COMPARATIVE SUSTAINABILITY ANALYSIS OF PIPE MATERIALS protection on DI pipe.113 Even with polyethylene encasement (which is not approved by the National Association of Corrosion Engineers as a corrosion control method)114 and with the use of thicker class pipe to achieve additional sacrificial pipe wall depth, ductile iron pipe can have a service life of less than 50 years due to corrosive soils. Other factors affecting ductile iron pipe’s service life include deterioration of the cement lining and internal corrosion. These factors reduce the pipe’s ability to meet customer demands. Moreover, only the lining of cement-mortar lined ductile iron pipe is certified to NSF/ANSI Standard 61 Drinking Water System Components – Health Effects. The inside of the ductile iron pipe wall is not certified to NSF/ANSI 61. When the cement-mortar lining degrades during use or breaks off during tapping, installation, transport or mishandling, potable water can come into contact with iron material, thus posing a potential risk to the public health. As well, the bell area of DI pipe poses a risk to public health since potable water is exposed to a non-certified surface as it passes through this portion of the pipe. The capital cost of installing a new PVC pipe can be nearly 23% less expensive than cleaning and re-lining existing ductile iron pipe.115 today’s thinner-walled ductile iron (DI) pipes.107 However, for much of the time these older pipes were underperforming hydraulically. They were also causing water quality issues and required expensive maintenance. “Corrosion is the main cause in ductile iron pipe failure, followed by transverse break failure and then joint failure.”108 As previously stated, 75% of the utilities in the United States have corrosive soil conditions. The rate of corrosion through the thickness of the pipe wall results in a less than 50-year life for ductile iron pipe.109 110 Clay soils tend to have much higher corrosion rates than other soil types.111 With the standard wall dimension as low as 0.25-inch, a moderate corrosion rate can generate pit depths that penetrate the ductile pipe walls in less than a decade. Incorrect or overuse of cathodic protection can corrode ductile iron pipes. Acceptance of polyethylene encasement as a viable corrosion control method is still a controversial subject in the corrosion control community. Claims by pipe manufacturers, coating suppliers and cathodic protection firms are often slanted by their vested interests in selling their products.112 Many corrosion engineers consider polywrap to be an ineffective means of corrosion 49 FIGURE 9.1 : IRON PIPE WALL THICKNESS REDUCTIONS OVER TIME Actual Size of AWWA Specification Thickness Reductions for 36" Diameter Cast and Ductile Iron Pipe - 1908 to Present (150 PSI Operating Pressure) 1.58 in. 1.22 in. 0.94 in. 0.87 in. 0.58 in. 0.43 in. 0.38 in. 0.21 in. 1908 CLD CI 1952 CL150 CI 1957 CL23 18/40 CI 1957 CL22 21/45 CI 1976 CL3 DI 1985 CL50 DI 1991 CL150 DI Planned pipe, the actual embodied energy is lower. Similarly, the amount of carbon dioxide emitted during the production of PVC pipe is far below that of ductile iron. Ductile Iron (DI) LCA and Embodied Energy 9.1.2 Sources used for this study assumed that the weight of mortar lining increases in proportion to the diameter of ductile iron pipe, so the embodied energy of mortar-lined ductile iron per kilogram can be assumed to be a constant value. According to the Ductile Iron Pipe Research Association (DIPRA), the ductile iron pipe industry has conducted an LCA.116 Unfortunately, the LCA results have not been released to the public and could not be used in this report. However, published studies were found that analyzed the embodied energy of ductile iron pipe. When comparing the material energy of pipes such as ductile iron, it is very important to consider the weight per foot of an actual pipe product. Because PVC weighs less than an equivalent length of DI For DI pipe, the corrosion potential of interior and exterior pipe walls may require the addition of other materials such as a cement lining on the interior and a polyethylene encasement with or without an anti-microbial biocide and a corrosion inhibitor, asphalt coating or
another material on the exterior. These additional materials increase resource consumption, embodied energy and the carbon footprint of the product. When evaluating the sustainability of piping products for life cycle design, it is important to understand and evaluate the life cycle impacts of all materials used in the piping system. The European Plastics Pipes and Fittings Association (TEPPFA) commissioned an LCA comparing DI and PVC pipes.117 A similar LCA study was conducted by the Environmental Modelling Laboratory at the Polytechnic University of Catalonia in 2005.118 Though these studies did not include an evaluation of all the components of ductile iron piping systems, they showed, as with this study, that PVC pipe has far lower embodied energy and other impacts than ductile iron pipe. Ductile Iron (DI) Pipe Use-Phase Performance 9.1.3 Ductile iron pressure pipes begin service with a slightly larger internal diameter than PVC’s. However, usually by DI pipe’s third year of life, a greater amount of pumping energy is required than PVC pipe of the same nominal size and the same flow rate. DI pressure pipe’s pumping energy costs increase throughout its service life due to internal corrosion continually increasing frictional resistance, whereas PVC’s remain constant. Figure 9.2 delineates the difference between the 100-year cumulative pumping energy for 24-inch PVC and DI pressure pipes at the same flow rate. The DI pumping energy in Figure 9.2 includes DI being replaced after 50 years of service with a reset of its friction factor (C). If ductile iron pipe is used past it service life of 50 years, increasing frictional resistance causes higher pumping costs as well as operation and maintenance expenses. As discussed in the Appendix, the cumulative pumping energy for DI pipe would be much greater than shown in Figure 9.2 over a 100- year period without replacement, since the internal wall of the pipe degrades more and more with time. Understanding pumping energy over the pipe’s life cycle is very important since this impacts operating costs and the municipality’s carbon footprint for many decades. 50 FIGURE 9.2 : COMPARISON OF CUMULATIVE 100-YEAR PUMPING ENERGY FOR 24" PVC AND DI PIPE The AWWA Standard for DI pipe, AWWA C151, does not require NSF International listing for potable water use. Therefore, in order to be used for the transportation and distribution of potable water, DI pipe must be lined with an NSF listed lining material such as cement-mortar or epoxy. This lining reduces the internal diameter and changes the friction factor. Studies have documented that the friction factor of mortar linings decreases over time. This additional frictional resistance increases the pumping effort to deliver a constant flow rate of water and it decreases the amount of water that can be delivered in a distribution system over time. Cumulative 100-Year Pumping Energy Comparison 24" PVC DR25 vs. 24" DI CL51 PC200 45,000 40,000 Cumulative Pumping Energy (kWh) 35,000 30,000 25,000 20,000 15,000 When evaluating the sustainability of piping products for life cycle design, it is important to understand and evaluate the life cycle impacts of all materials used in the piping system. 10,000 5,000 0 0 10 20 30 40 50 60 70 80 90 100 Years PVC Cumulative Pumping Energy (kWh) DI Cumulative Pumping Energy (kWh) Note: Graph assumes replacement of DI pipe at 50 years.